
Figures & data
Figure 1. Assembled Vitrocell® 24/48 ALI exposure system with exploded views of the top and bottom plates, horn and a diagram of the aerosol path (blue arrows) in the assembled system.
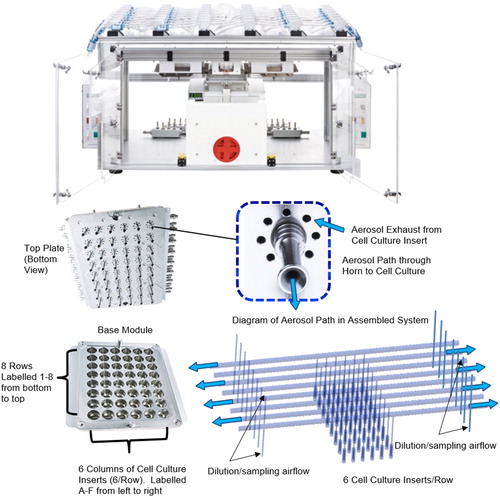
Figure 2. Diagram (not to scale) of the aerosol generation and dilution system.
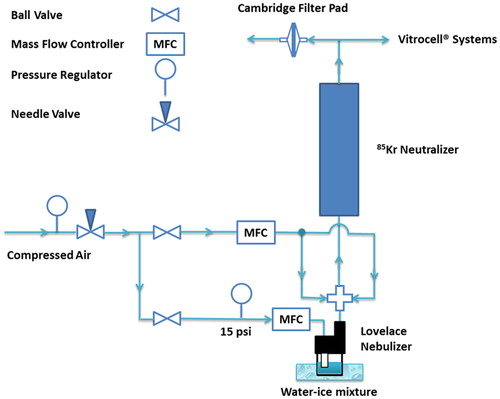
Figure 3. Simulation geometry and Lagrangian mesh for one cell culture insert.
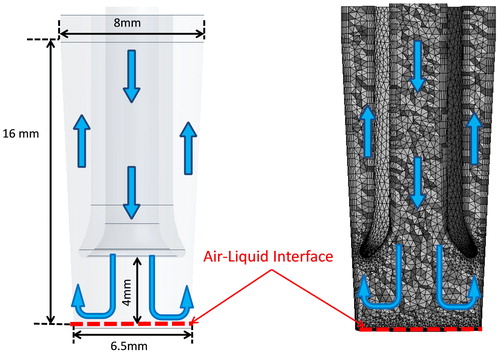
Table 1. Comparison of mean experimentally measured and CFD predicted particle deposition efficiency as a function of particle MMAD in the Vitrocell® 24/48 ALI in vitro exposure system.
Figure 4. Mean experimentally measured particle deposition uniformity across the six cell culture inserts in a row by particle size in MMAD (top = 0.51, second = 1.1, third = 2.2, and bottom = 3.3 µm MMAD) in four equal area quadrants (top four rows) and a circle and three rings with equal area (bottom four rows) expressed as percent of mean. Each cell culture insert is a mean of 24 experimental measurements (8 rows/run; three experimental runs). Airflow is moving from left to right.
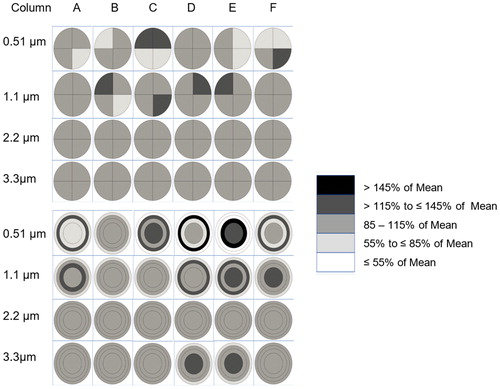
Figure 5. Experimentally measured particle deposition uniformity across cell culture inserts in a column by particle size in MMAD in four equal area quadrants (left four columns) and circle and three rings with equal area (right four columns) expressed as percent of mean. Each cell culture insert is a mean of 18 experimental measurements (6 inserts/run; three experimental runs). Airflow is moving from left to right.
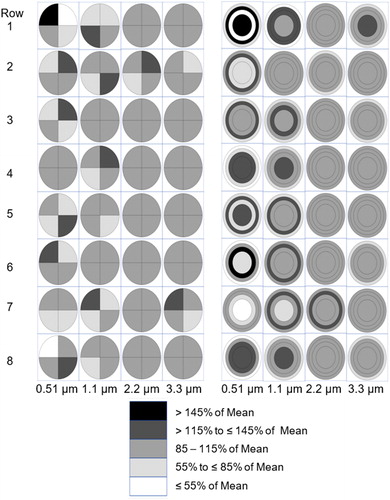
Table 2. Lagrangian and Eulerian CFD predicted particle deposition efficiency as a function of particle MMAD (Lagrangian simulation used 107 particles injected at channel entrance with 500 s simulation) in the Vitrocell® 24/48 ALI in vitro exposure system including all deposition sites.
Figure 6. Lagrangian CFD predicted particle deposition uniformity across six cell culture inserts in a row by particle size (top = 0.51, second = 1.1, third = 2.2, and bottom = 3.3 µm MMAD) in four equal area quadrants (top four rows) and circle and three rings with equal area (bottom four rows) expressed as percent of mean. One million particles were injected at the entrance of the in vitro exposure system with airflow moving from left to right.
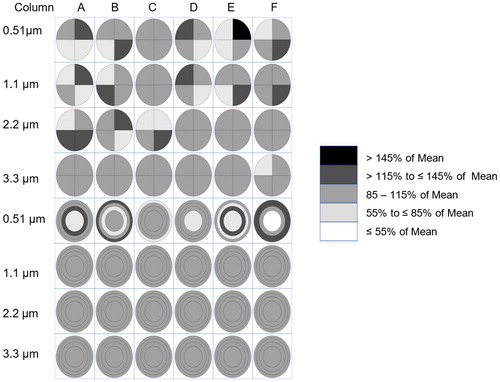
Figure 7. Deposition efficiency [%] vs. particle MMAD [µm] for the experimental measurements (blue line), the Lagrangian CFD predictions (green line) and the Eulerian CFD predictions red line).
![Figure 7. Deposition efficiency [%] vs. particle MMAD [µm] for the experimental measurements (blue line), the Lagrangian CFD predictions (green line) and the Eulerian CFD predictions red line).](/cms/asset/6c8354da-204b-4d42-a00f-841b7c40fc6c/uast_a_1676877_f0007_c.jpg)