
Figures & data
Figure 1. Experimental setup of the flow tube used to calibrate aerosol acidity, using the C-RUV method under varying humidity and aerosol compositions (-
-
or
-
-
-
).
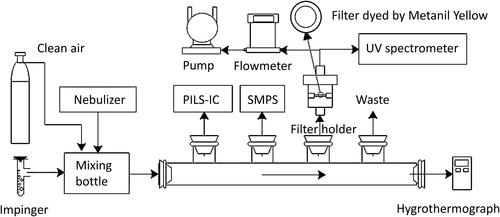
Table 1. Inorganic aerosols produced in the flow tube for the calibration of aerosol acidity using the C-RUV method.
Figure 2. Measured proton concentration ([H+]C-RUV,E-AIM) in a (NH4)xHySO4 aerosol system using the C-RUV calibration curve (estimated with E-AIM). [H+]C-RUV,E-AIM is compared to the proton concentration predicted by E-AIM ([H+]E-AIM) and ISORROPIA ([H+]ISORROPIA) models.
![Figure 2. Measured proton concentration ([H+]C-RUV,E-AIM) in a (NH4)xHySO4 aerosol system using the C-RUV calibration curve (estimated with E-AIM). [H+]C-RUV,E-AIM is compared to the proton concentration predicted by E-AIM ([H+]E-AIM) and ISORROPIA ([H+]ISORROPIA) models.](/cms/asset/8b064d5f-c9ae-4be1-9dd9-e083902aeef5/uast_a_1711510_f0002_b.jpg)
Figure 3. [H+]C-RUV, ISORROPIA in the (NH4)xHySO4 aerosol system using the C-RUV calibration curve (estimated with ISORROPIA). [H+]C-RUV is compared with both [H+]E-AIM and [H+]ISORROPIA.
![Figure 3. [H+]C-RUV, ISORROPIA in the (NH4)xHySO4 aerosol system using the C-RUV calibration curve (estimated with ISORROPIA). [H+]C-RUV is compared with both [H+]E-AIM and [H+]ISORROPIA.](/cms/asset/5b225068-cee8-46cd-9b03-fbd114930e65/uast_a_1711510_f0003_b.jpg)
Figure 4. Comparison of [H+]C-RUV,E-AIM in the (NH4)xHySO4 aerosol system with the predicted [H+]E-AIM and [H+]ISORROPIA under varying FS at a given RH.
![Figure 4. Comparison of [H+]C-RUV,E-AIM in the (NH4)xHySO4 aerosol system with the predicted [H+]E-AIM and [H+]ISORROPIA under varying FS at a given RH.](/cms/asset/83156785-75fa-413e-877d-95d035034927/uast_a_1711510_f0004_b.jpg)
Figure 5. Comparison of [H+]C-RUV,ISORROPIA in the (NH4)xHySO4 aerosol system with the predicted [H+]E-AIM and [H+]ISORROPIA under varying FS at a given RH.
![Figure 5. Comparison of [H+]C-RUV,ISORROPIA in the (NH4)xHySO4 aerosol system with the predicted [H+]E-AIM and [H+]ISORROPIA under varying FS at a given RH.](/cms/asset/98fd9f49-51a1-4e1f-8c28-4524bc574e4e/uast_a_1711510_f0005_b.jpg)
Figure 6. Classification of the ambient aerosol collected at the sampling site located on campus at the University of Florida, Gainesville, Florida. Detailed information on ambient sampling is provided in .
Table 2. Ambient sampling information and meteorological conditions.