
Figures & data
Table 1. Counting efficiency requirements according to NPTI device specifications.
Figure 1. Pulsed-mode measurement configurations based on diffusion charging: (a) conventional diffusion charging (CDC), (b) modulated precipitation (MP), under the assumption of initially uncharged particles.
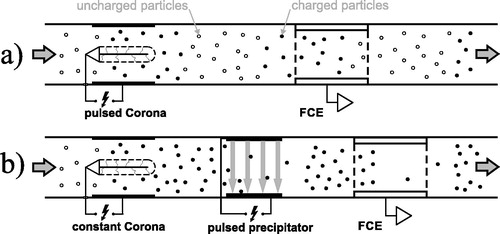
Figure 2. Simplified schematic of the experimental setup used for mean charge and counting efficiency measurements at Test Facility 1, and for counting efficiency and linearity measurements at Test Facility 2.
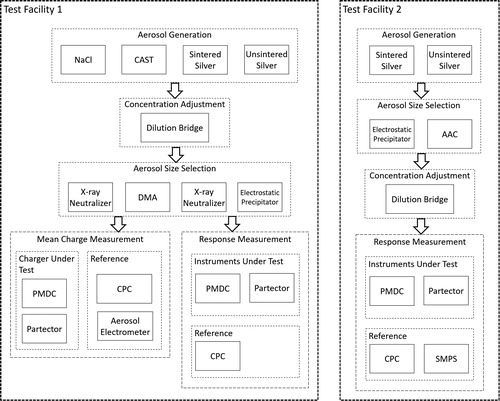
Figure 3. Counting efficiency curves of NaCl, soot, and silver particles (sintered and unsintered), measured at Test Facility 1 with the pulsed-mode modular diffusion charger (PMDC) in modulated precipitation (MP) (a) and conventional pulsed-mode diffusion charging (CDC) (b) configuration, and with the Naneos Partector (c). NPTI CE limits according to are visualized by the dark red boxes.
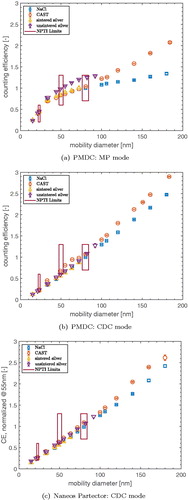
Table 2. Diesel vehicles used for tailpipe PN measurements in the field.
Figure 4. Mean charge curves for the PMDC charging unit (a) and the Naneos Partector (b), measured at Test Facility 1 for sintered/unsintered silver, soot, and NaCl particles. A linear regression is applied to the mean charge curves, with the slope k used to calculate the charge difference.
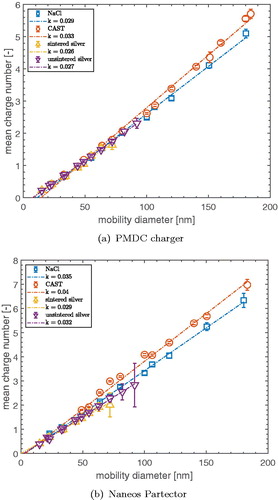
Table 3. Estimated effective density of silver particles used at Test Facility 2.
Figure 5. Counting efficiency measured with the PMDC, operated in MP mode (a) and the Naneos Partector (b) with sintered and unsintered silver particles at Test Facility 2. The mobility diameter (GMD) was measured with an SMPS. Dashed lines are a guide to the eye.
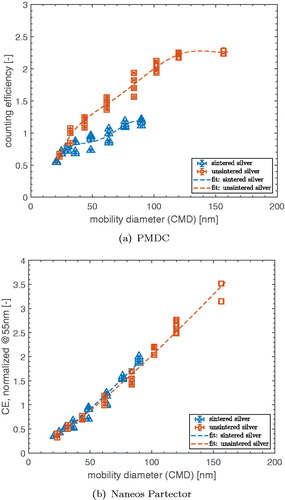
Figure 6. Linearity to PN for the PMDC and the Naneos Partector, measured with sintered silver particles with a mobility diameter between 36 and 90 nm. Both linearity curves are fitted with a function Additionally, a 25% error with respect to the fit function is plotted.
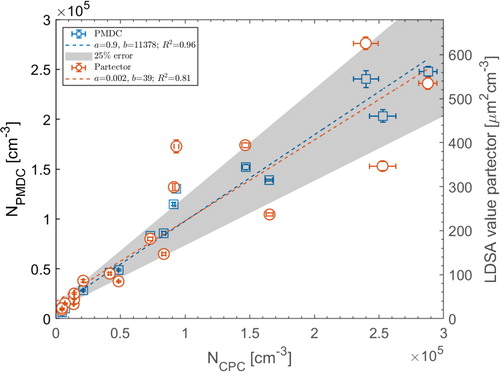
Figure 7. CE curves used for the error estimation: idealized CE of an automotive PNC (solid, green line), interpolated PMDC CE (MP mode) for salt particles (dashed, blue line) and soot particles (dotted, red line).
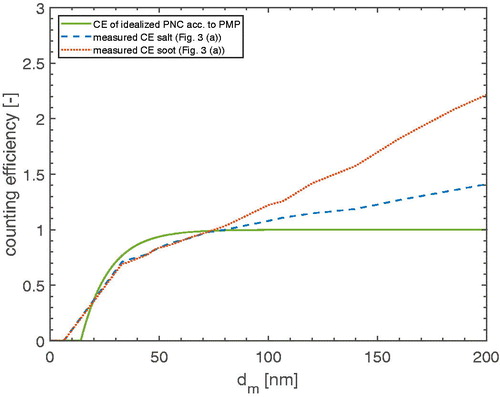
Figure 8. Typical number-weighted particle mobility diameter distributions for solid, automotive exhaust particles for diesel (a) and GDI (b). The original curves (purple) are multiplied with interpolated counting efficiency curves of an ideal PNC and the PMDC, shown in .
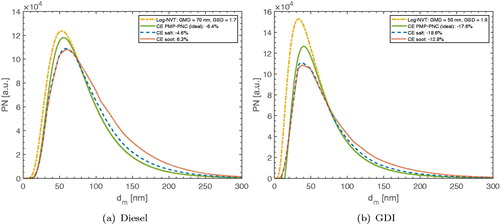
Table 4. Tailpipe PN measurement results.