Figures & data
Figure 1. Simulation schematic of the impinging jet with micron and submicron droplets: (a) 3D sketch; (b) scale and boundary conditions; (c) mesh setup.
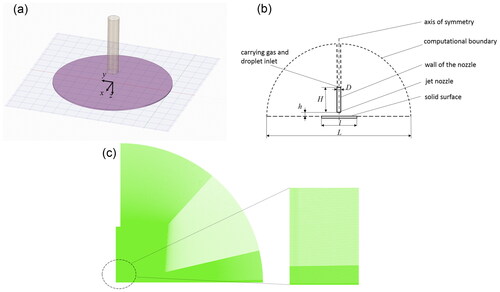
Figure 2. Size distribution of the injected micro and nano droplets. The average diameter (Sauter mean diameter) of the droplets is 4.85 µm.
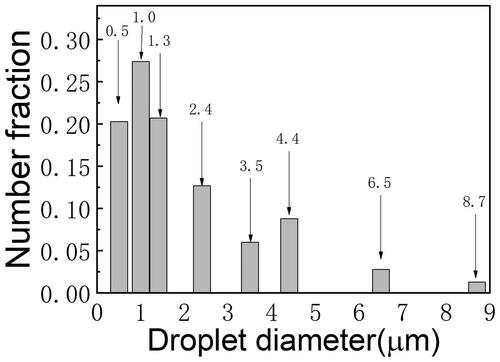
Figure 3. Normalized velocity profiles and turbulence intensity in simulation compared with the experiment: (a) normalized velocity profile at z/D = 1 and z/D = 3; (b) normalized turbulence intensity at z/D = 1 and z/D = 3. z is the distance to the nozzle in streamwise direction and x is the distance to the centerline in radial direction.
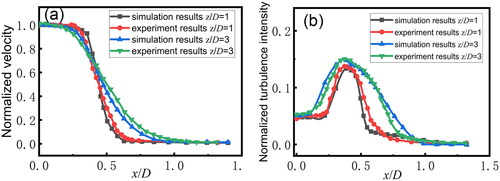
Figure 4. Dual-ring deposition patterns in experiment and simulation: (a) experimental result where the gray level stands for the normalized thickness of the deposited liquid; (b) simulation result in two-way coupling method with coalescence being considered. The number for the different sized circles is the droplet diameter value in micron.
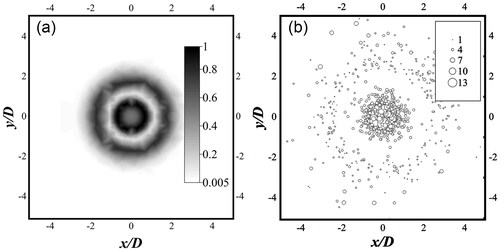
Figure 5. Simulation results: (a) velocity profile in part of the computational region; (b) velocity vector in part of the computational region; (c) normalized turbulent intensity in a straight line near the plate, the distance between the line and the plate is 0.5 mm; (d) turbulence intensity distribution. The turbulence intensity near the wall is lower than the turbulence intensity away from the wall in the region near the outer ring.
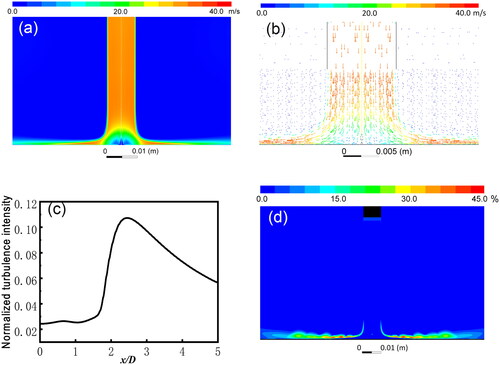
Figure 6. Relative thickness distributions under different droplets volume fractions: (a) αV = αV0.1; (b) αV = αV1 = 10−5; (c) αV = αV2; (d) αV = αV4; (e) αV = αV8. The modeling choice of the one or two-way coupling with or without coalescence calculation are compared.
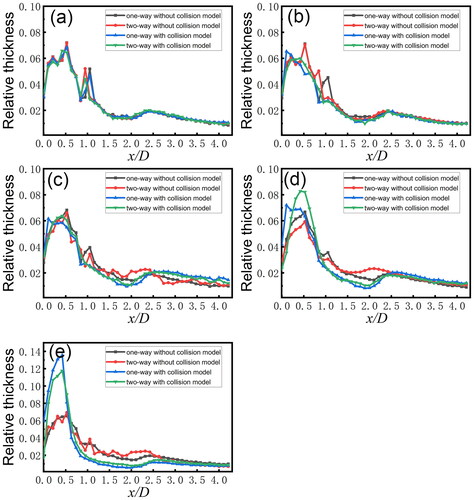
Figure 7. Results of the Sauter mean diameters of the deposited droplets under different simulation settings. The deposited droplets are bigger with the coalescence calculation.
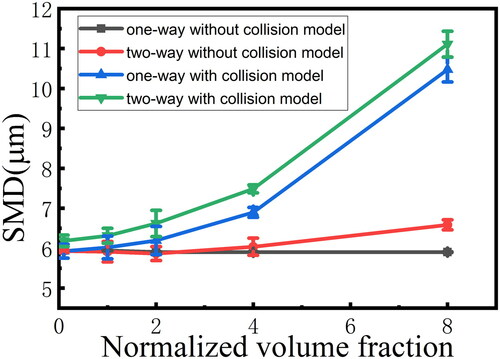
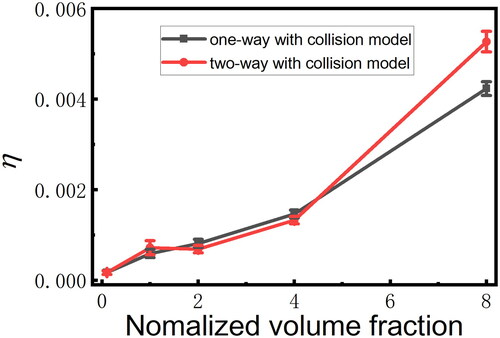
Figure 8. Simulated collision ratio with different droplet volume fractions.