Figures & data
Figure 1. Cylindrical particulate flow through a curved tube.
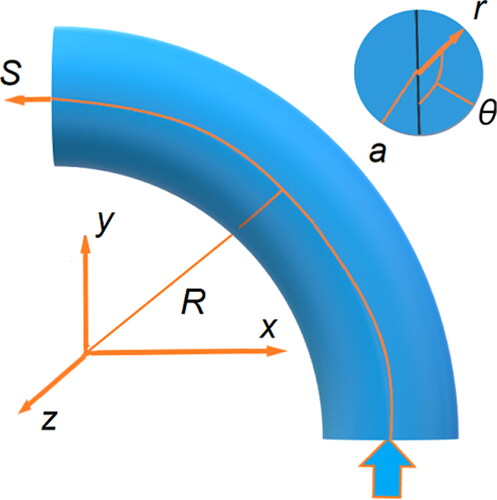
Figure 2. Two coordinate systems.
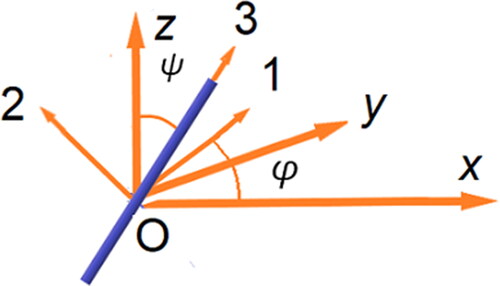
Figure 3. Schematic of collision of two cylindrical particles.
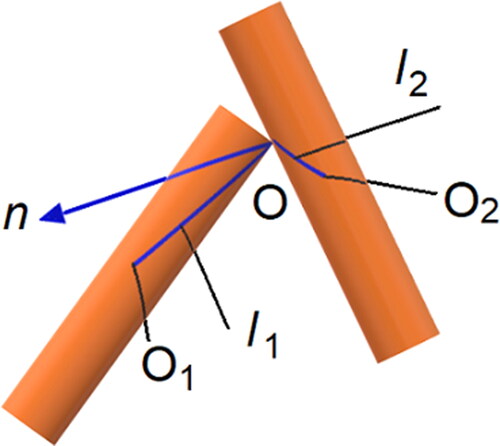
Figure 4. Distribution of mean axial velocity (a) and RMS value of fluctuating axial velocity (b) along the tube midplane (white line) (Re = 10,500, De = 2460).
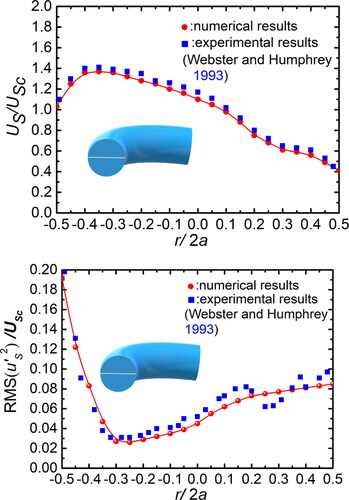
Figure 5. Distribution of relative particle number concentration on the cross-section at different axial positions (Re = 10,500, St = 0.014, De = 1862, β = 8). (a) S/Lb =0, (b) S/Lb =1/3, (c) S/Lb =2/3, and (d) S/Lb = 1.
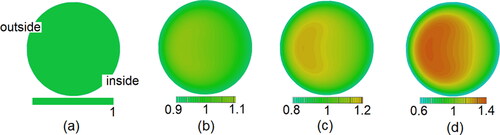
Figure 6. Distributions of mean orientation of particles on the cross-section at different axial positions. (Re = 10,500, St = 0.014, De = 1862, β = 8).
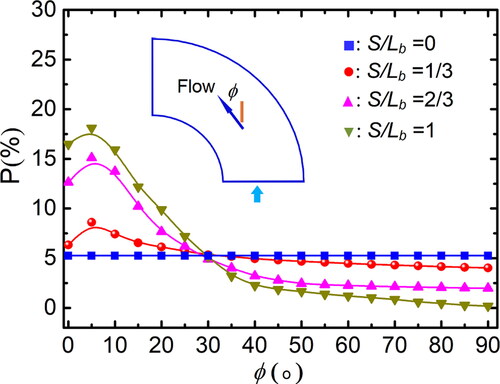
Figure 7. Distribution of relative particle number concentration on the cross-section at outlet. (a) St = 0.020, De = 1862, Re = 10,500, β = 8, (b) St = 0.014, De = 2460, Re = 10,500, β = 8, (c) St = 0.014, De = 1862, Re = 4500, β = 8, and (d) St = 0.014, De = 1862, Re = 10,500, β = 4.
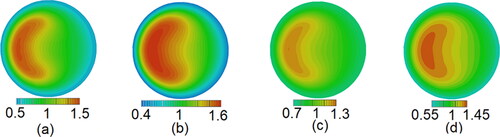
Figure 8. Distribution of particle orientation for different St (Re = 10,500, De = 1862, β = 8).
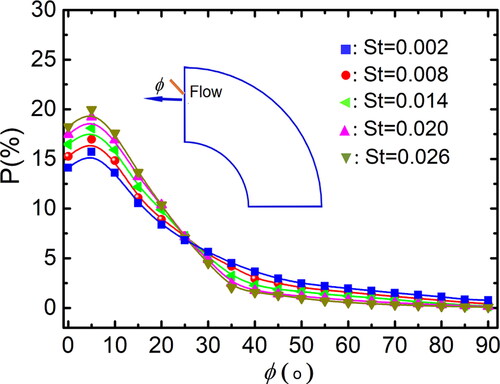
Figure 9. Distribution of particle orientation for different De (Re = 10,500, St = 0.014, β = 8).
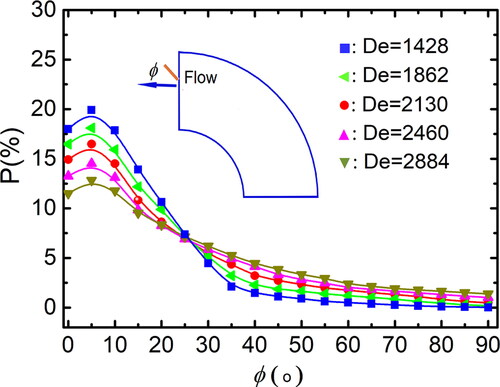
Figure 10. Distribution of particle orientation for different Re (De = 1862, St = 0.014, β = 8).
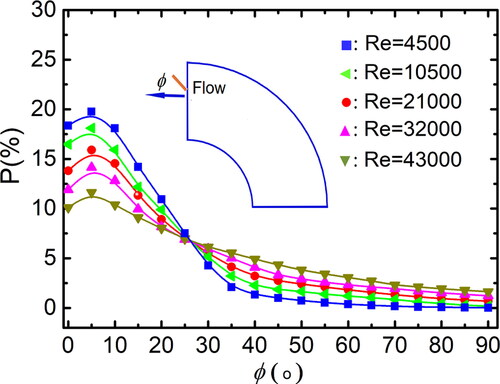
Figure 11. Distribution of particle orientation for different aspect ratio (Re = 10,500, De = 1862, St = 0.014).
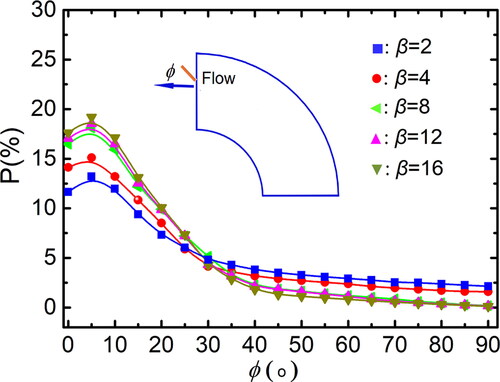
Figure 12. Penetration efficiency as a function of Stokes number and aspect ratio (Dean = 1862, Re = 10,500).
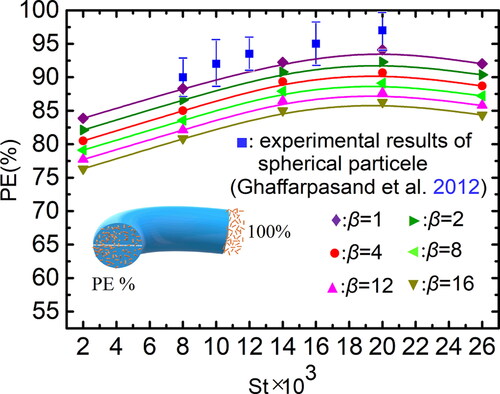
Figure 13. Penetration efficiency as a function of St and De (β = 8, Re = 10,500).
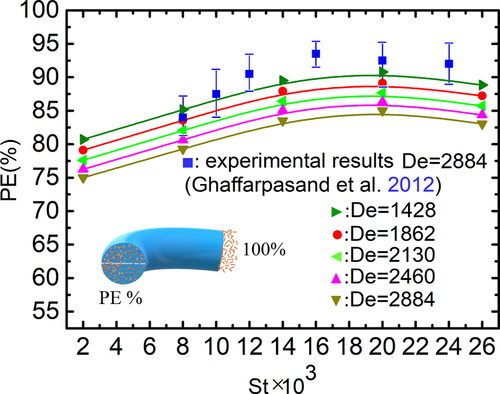
Figure 14. Penetration efficiency as a function of St and Re (β = 8, Dean = 1862).
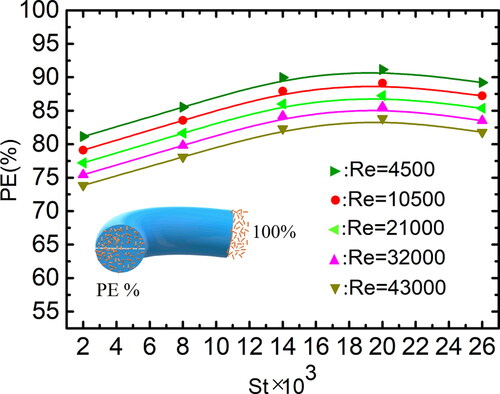
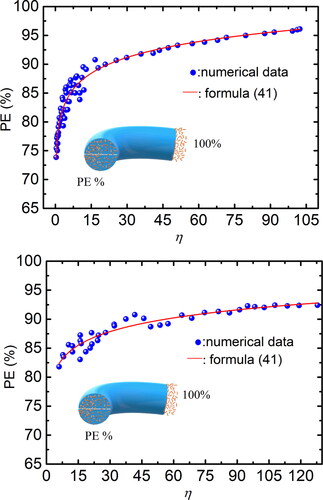
Figure 15. Penetration efficiency as a function of related synthetic parameter. (a) St ≤ 0.02; (b) St > 0.02.