
Figures & data
Figure 1. Example of inverted HTDMA measurements of particles having dry electrical mobility diameters of 30 (a) and 90 (b) nm, and their corresponding hygroscopic factor(s) at 87% RH, conducted in booth #3 when the door was open and no activity was taking place. Note that the 30-nm particles were internally mixed (i.e., unimodal distribution when exposed to 87% RH), while in contrast their 90-nm counterparts exhibited a wider distribution upon humidification in these measurements. This can be analyzed in two separate modes (indicating that they were externally mixed), thus having two hygroscopic factors (i.e., g1 and g2).
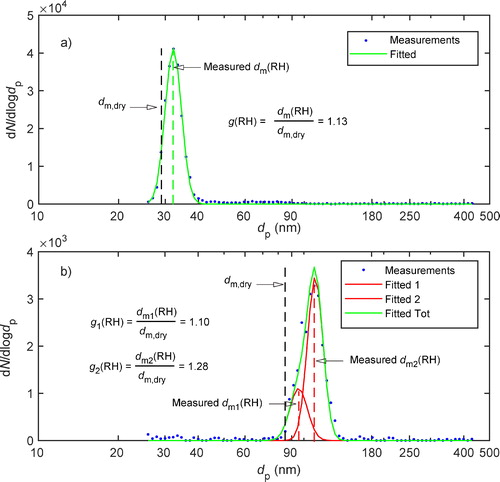
Figure 2. Example of an inverted HTDMA measurement of particles having a dry electrical mobility diameter of 90 nm, and their corresponding hygroscopic factor at 87% RH, carried out in booth #3 during thermal spraying. Note that in these measurements, the assumed 90-nm particles (i.e., determined based on the operational settings of DMA-1, assuming that the particles have a spherical shape) exhibited a unimodal distribution (i.e., internally mixed) when exposed to 87% RH, with a hygroscopic factor <1.0. The latter is a clear indication of hydrophobic particles with irregular shape that undergo restructuring upon humidification at 87% RH.
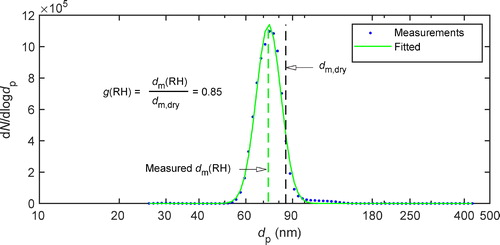
Figure 3. Evolution of the particle number size distributions: (a) inside booth #1 (APS) and (b) inside booth #3 (HVOF). Total particle number concentrations (dashed black curve) and the corresponding size distributions (NanoScan-SMPS) are shown for both processes.
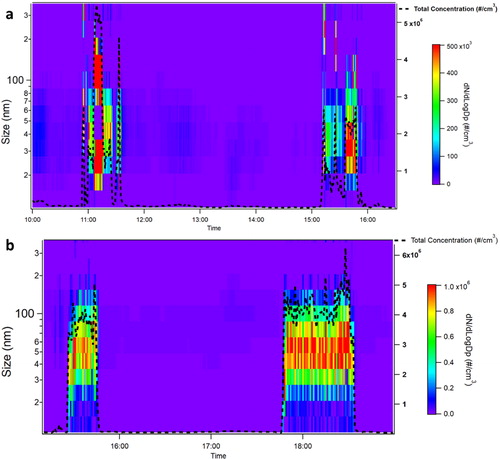
Figure 4. Modal analysis results for particles emitted inside booth #1 (a–c) and inside booth #3 (d, e). The time intervals (a, c and d, e) represent different repetitions of each thermal spraying process, for comparison one afternoon break interval (i.e., no activity period) is also marked (b). The numbers in the pie plots depict the average number concentration of each mode (in #/cm3), while the percentages (i.e., in parenthesis) provide the average fraction of the number concentration of each mode in respect to the total number concentration of particles.
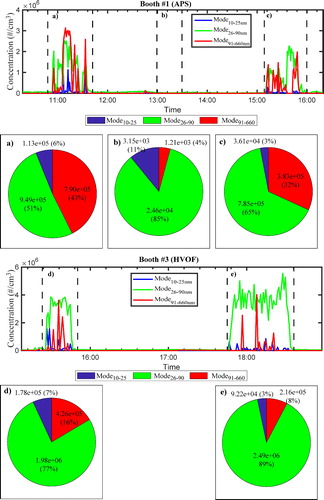
Figure 5. Aggregated hygroscopic factor measurements (a) and median values of the relative number fraction of each hygroscopic mode (b) of particles having electrical mobility diameters of 30 nm sampled with the HTDMA when the processes in booth #1 (APS) and booth #3 (HVOF) were active. Results are also shown when booth #3 was active but the HTDMA sampled from the storage area outside booth #3 (SA). Particles exhibiting hygroscopic factors below 1.15 (hydrophobic/less hygroscopic; HP) are denoted with a different color (i.e., blue) than the more hygroscopic ones (i.e., hygroscopic factor > 1.15; HS). The dotted circles denote the median values of each hygroscopic mode, whereas the range and the 25th and 75th percentiles are depicted with narrow and wide solid lines, respectively.
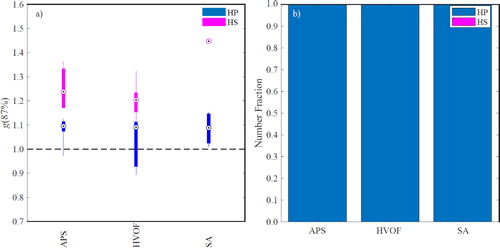
Figure 6. Aggregated hygroscopic factor measurements (a) and median values of the relative number fraction of each hygroscopic mode (b) of particles having electrical mobility diameters of 90-nm that were sampled by the HTDMA when the processes in booth #1 (APS) and booth #3 (HVOF) were active. Results are also shown when booth #3 was active but the HTDMA sampled from the storage area outside booth #3 (SA). Particles exhibiting hygroscopic factors below 1.15 (hydrophobic/less hygroscopic; HP) are denoted with a different color (i.e., blue) than the more hygroscopic ones (i.e., hygroscopic factor >1.15; HS). The dotted circles denote the median values of each hygroscopic mode, whereas the range and 25th and 75th percentiles are depicted with narrow and wide solid lines, respectively.
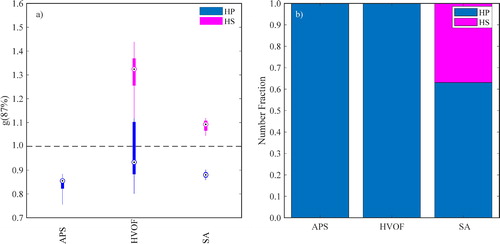
Figure 7. TEM images of the particles emitted during APS in booth #1 (a, b), and during HVOF in booth #3 (c, d).
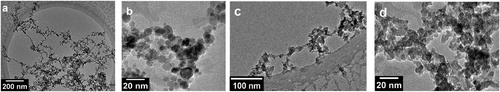
Table 1. Results showing the average and standard deviation (where applicable) of the estimated dynamic shape factor χ of the irregularly shaped particles (i.e., g(87%) < 1.0).