
Figures & data
Figure 1. A scanning electron microscopy (SEM) image of BSi used in this study. A top view of the surface (top left), a cross-sectional of the pillars (top right), and another cross-sectional view of the surface. Dust particles are impaled by the pillars (bottom).
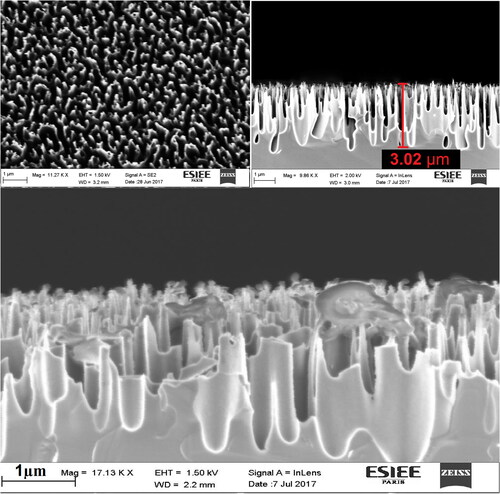
Figure 2. A schematic illustration of the deposit shapes.
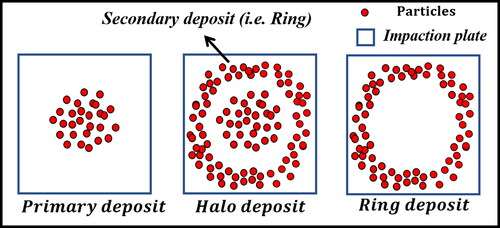
Figure 3. SEM of the deposition characteristics of fluorescent particles of different sizes on Si and BSi surfaces.
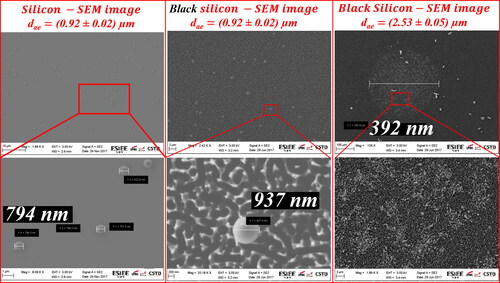
Figure 4. The local collection efficiency on a 0.75 mm2 surface area, based on optical microscopy images, for investigations of fluorescent particles on the primary impaction zone of a silicon surface.
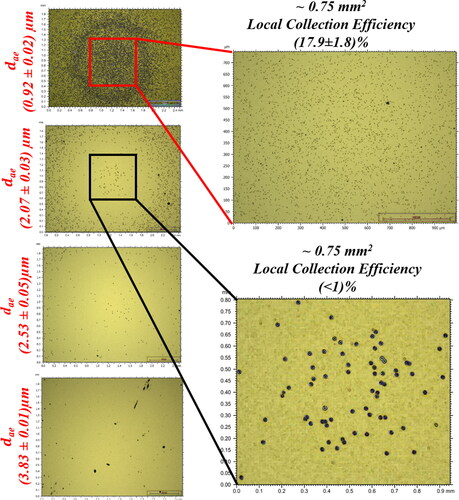
Figure 5. SEM images of Aspergillus niger impaction onto a black silicon surface.
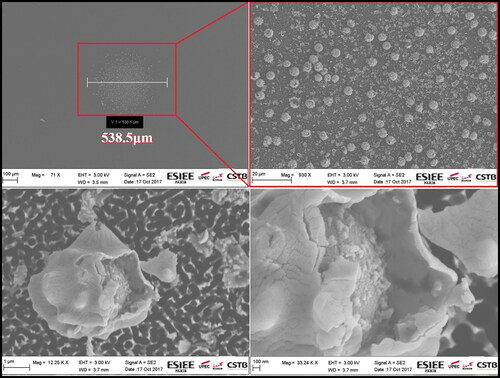
Figure 6. Schematic illustrations of rebound and re-entrainment theory. (Adapted from Paw U Citation1983.)
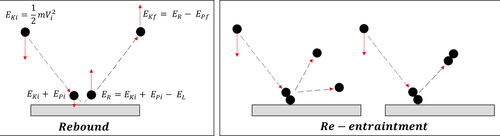
Table 1. A summary of the deposition characteristics of the particles.