Figures & data
Table 1. Experiments and conditions used to form SOA for analysis of functional group composition using the Deriv-Spec and FTIR methods.
Figure 1. Functional group composition of SOA formed in environmental chamber experiments designed to mimic daytime reaction conditions observed during the SOAS field campaign and analyzed using the Deriv-Spec (CU) and FTIR (SIO) methods. These correspond to experiments 1–4 in .
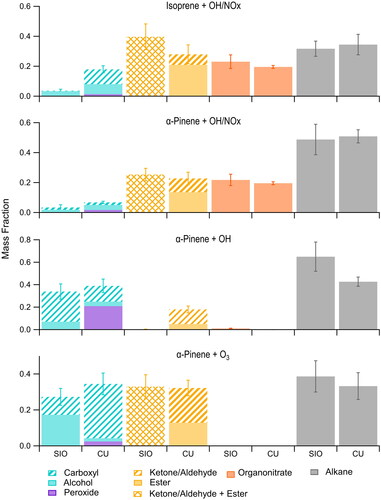
Figure 2. Functional group composition of SOA formed in environmental chamber experiments designed to mimic nighttime reaction conditions observed during the SOAS field campaign and analyzed using the Deriv-Spec (CU) and FTIR (SIO) methods. These correspond to experiments 6–9 in . Note that reactions with O3 (experiment 1, ) can also occur at night.
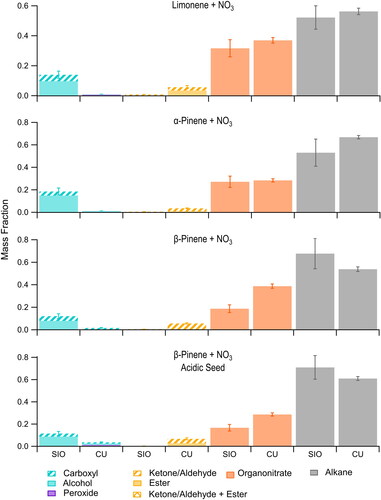
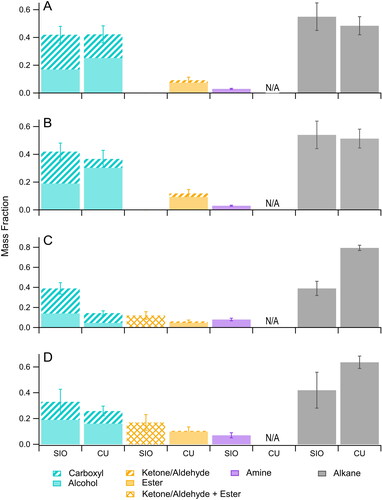
Figure 3. Functional group composition of SOAS samples collected at (a,b) Look Rock, TN and (c,d) Centerville, AL measured using the Deriv-Spec (CU) and FTIR (SIO) methods. (a) and (b) were combined daytime + nighttime samples collected under low NOx conditions and high NOx conditions, respectively, (c) was a nighttime sample collected under low NOx conditions and (d) was a daytime sample collected under high NOx conditions.