
Figures & data
Figure 1. UTARTS facility (University of Tokyo Aerosol Removal Tests facility with Sprays).
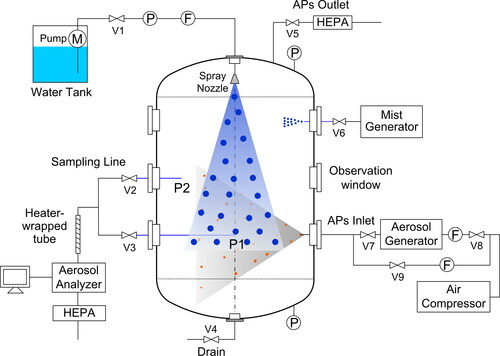
Table 1. Experimental cases and conditions.
Figure 2. Mist size distribution at low and high concentration levels (Liang et al. Citation2021).
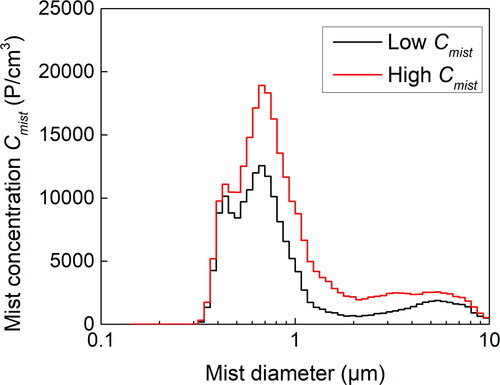
Figure 3. Droplet size distribution of three nozzles.
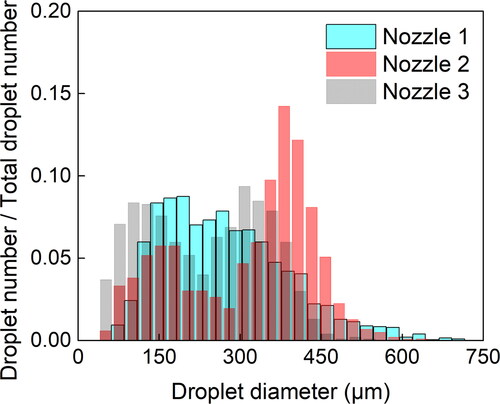
Figure 4. Spray droplet streamlines (left) and droplet velocity magnitude at 250 mm below the nozzle outlet (right) of three nozzles: (a) nozzle 1; (b) nozzle 2; (c) nozzle 3.
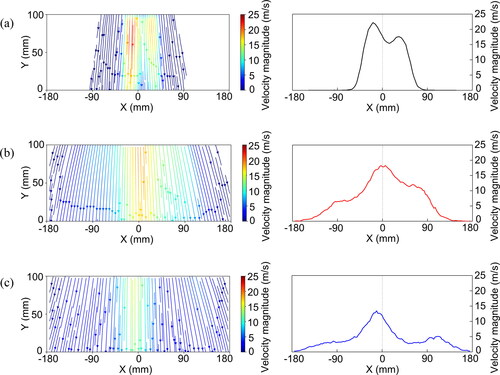
Figure 5. Temperature and humidity monitored during spraying in case 7.
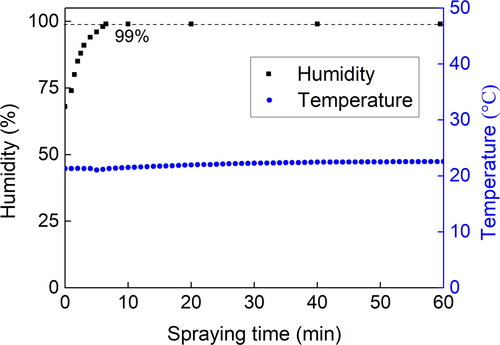
Figure 6. Time evolution of aerosol size distribution during spraying with high concentration mist using nozzle 2.
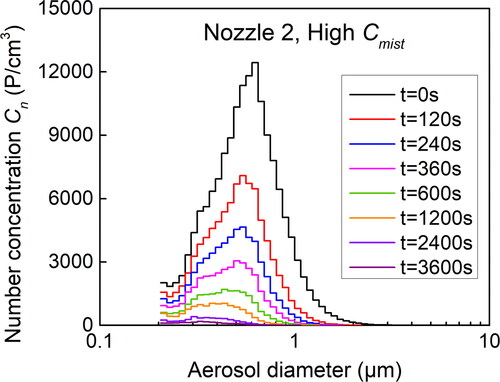
Figure 7. Global spray efficiency E of three nozzles at different mist concentration levels: (a) cases without mist; (b) cases with low Cmist; (c) cases with high Cmist.
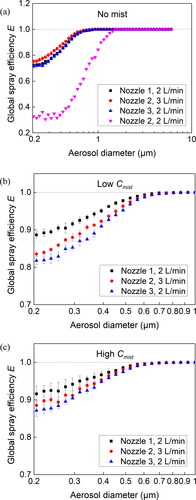
Figure 8. Time evolution of normalized total aerosol number concentration with 0.2 ≤ ≤ 1 μm using three nozzles at different mist concentration levels: (a) cases without mist; (b) cases with low Cmist; (c) cases with high Cmist.
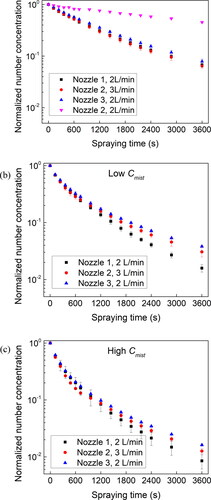
Figure 9. Aerosol removal rate of three nozzles at different mist concentration levels.
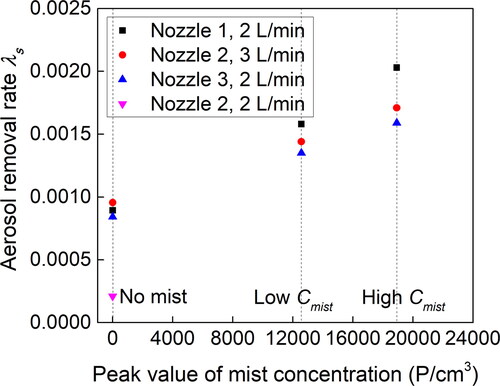
Table 2. Boundary conditions for simulation cases using different spray nozzles.
Figure 10. Spray droplets, velocity vectors of gas-phase, and aerosol mass fraction in simulation case II.
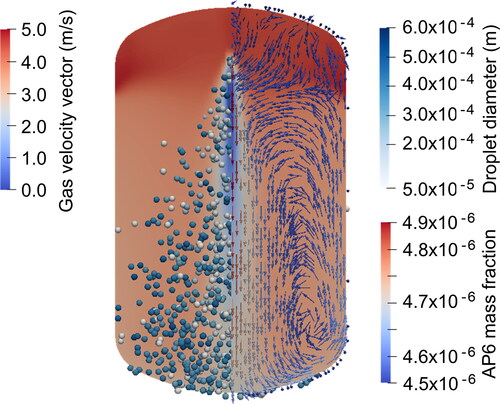
Figure 11. Comparison of aerosol mass fraction evolution at different flow regions in case I: (a) three sampling points inside the vessel; (b) time evolution of aerosol mass fraction at three sampling points.
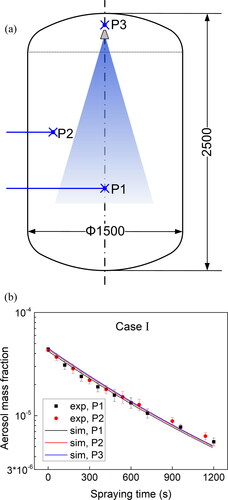
Figure 12. Time evolution of normalized aerosol mass at different diameters using three nozzles: (a) case I using nozzle 1 at 2 L/min; (b) case II using nozzle 2 at 3 L/min; (c) case III using nozzle 3 at 2 L/min.
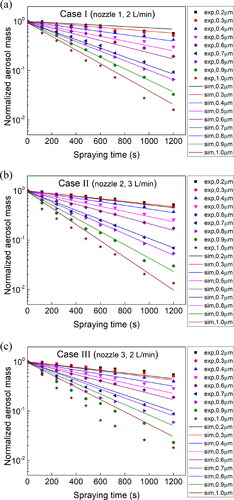
Figure 13. Aerosol Stokes number St at the spraying time t = 1200 s using three nozzles for particles at different diameters.
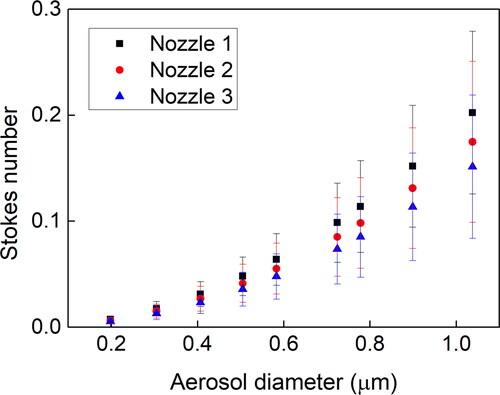
Figure 14. Schematic of aerosol particles captured by accumulated spray water and water film: (a) case I using nozzle 1; (b) case II using nozzle 2; (c) case III using nozzle 3.
Figure 15. Calculation method of gaseous entrainment flow rate
Table 3. Comparison of the circulation period of gaseous entrainment by different spray nozzles.
Table A1. Empirical formula of aerosol removal efficiency by a single droplet.