Figures & data
Figure 1. Schematic of the print head including capillary, antechamber, mixing chamber, and nozzle.
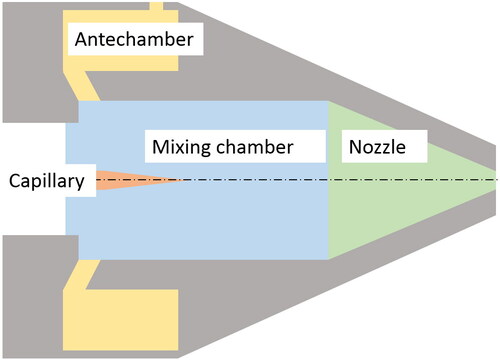
Table 1. Simulation parameters of the aerosol at the outlet of the capillary.
Figure 2. Simulation model for determining the operating point.
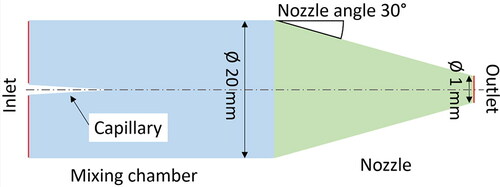
Figure 3. Mass flow of the sheath gas (Argon) over aerosol mass flow in double logarithmic representation. Upright crosses: Parameter combinations with successful function (no wall contact), tilted crosses: No functioning operation is possible (wall contact of the aerosol). The dashed straight line gives the limit range of functioning operating points. Circle: Operating point chosen for further simulations.
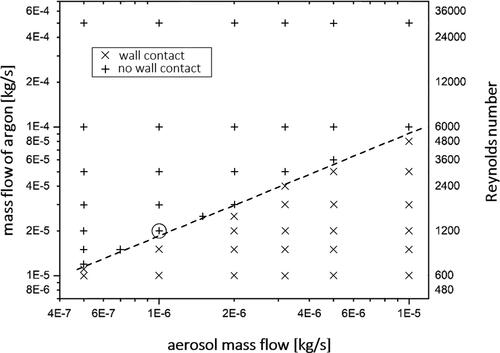
Figure 4. Simulation model for determining the focus point.
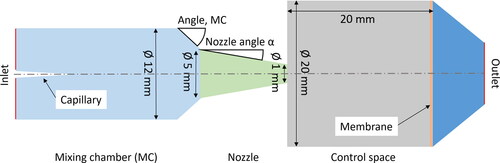
Figure 5. Left: Trajectories of the droplets in dependence of the nozzle angle. Red marked is the respective position of the focal point. Right: Variation of the Stokes number for two nozzle angles (10°, 15°).
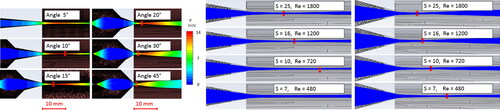
Figure 6. Initial model for the optimization of the antechamber. Red arrows: in- and outlets.
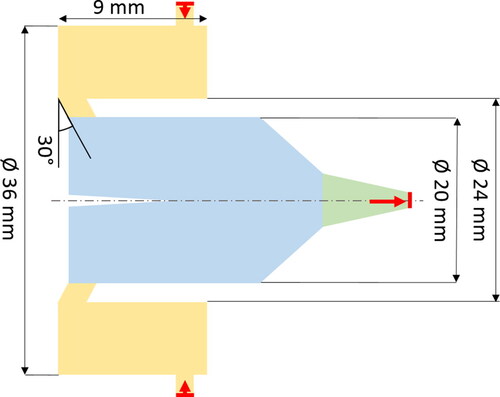
Figure 7. (a) to (c) Velocity distributions in the antechamber outer rings and the mixing chamber inner disk for three different geometries of the antechamber. The dashed lines specify the direction of the respective profile. (d) Scaled velocity distribution in the mixing chamber only (design case ).
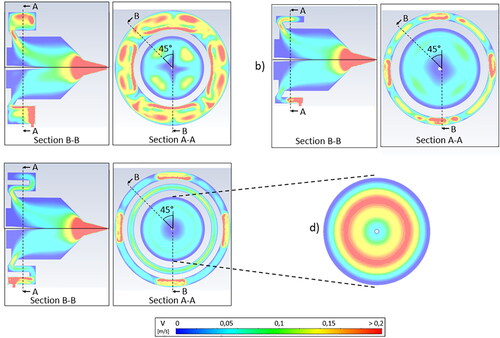
Figure 8. Simulation of the velocity progression in the droplet tracks. Left: of the entire print head; right: zoomed section with substrate distance of 8 mm (top) and substrate distance adjusted to the appropriate printing distance.
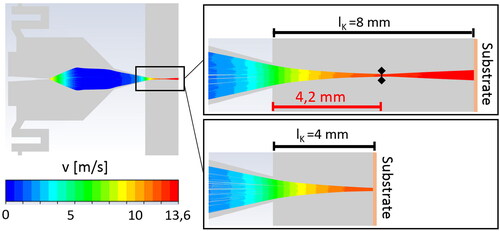
Figure 9. Schematic of the experimental setup.
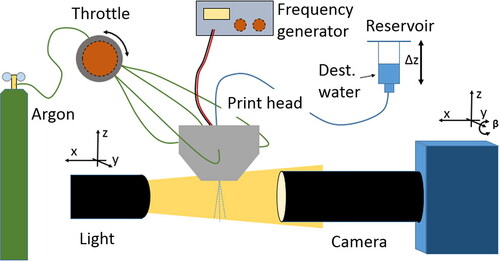
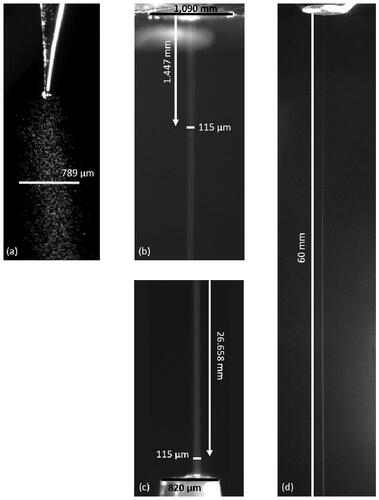
Figure 10. Unfocused aerosol jet at the capillary (a), the jet focused with the aid of the sheath gas at the nozzle orifice (b), on a target tip at a distance of 27 mm (c), and the collimated jet over a distance of 60 mm (d).