Figures & data
Figure 1. Schematic of the bipolar SMPS to measure charged particles of both polarities. Note that the conventional neutralizer is removed when measuring atmospheric aerosols using natural air ions.
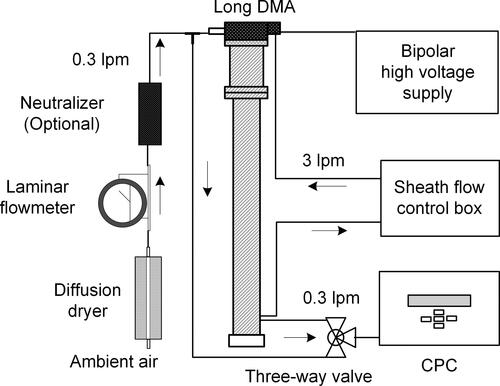
Figure 2. (a) Time series of daily averaged ion mobility ratios during the measurement period at Tsinghua site. The time resolution for the measured size distribution and thus the calculated ion mobility ratio is 5 min. The symbols and error bars represent daily average and standard deviation of the ratios. The average ratio value for each neutralizer and natural air ions during its measurement period are listed on the plot. Two horizontal dash lines are the fixed ion mobility ratios of 0.875 and 0.957 for developing the constant aerosol charge fractions by Wiedensohler (Citation1988) and Tigges et al. (Citation2015), respectively. In the lower panels are daytime and nighttime averaged ion mobility ratios during measurement periods using (b) natural air ions, (c) 85Kr neutralizer, and (d) SXR neutralizers. Each symbol represents one day, with the daytime averaged from 8:00–20:00 and the nighttime averaged from 20:00–8:00. The dash lines are for guiding the eyes. Note that natural air ions, 85Kr neutralizer, and SXR neutralizers were tested for 153, 58, and 103 days, respectively.
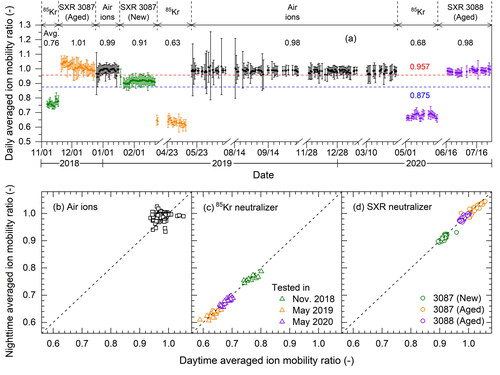
Figure 3. The concentration weighted mobility ratio of natural air ions at various atmospheric sites. Data for sites other than Beijing were adopted from previous studies. Detailed information and references are given in the SI. For datasets with a high time resolution (e.g., 5 min in this study), the ion mobility ratio was calculated for each scan; the triangle and error bar represent the average and standard deviation of all scans, respectively. The solid circle is ion mobility ratio calculated with average values of ion concentration and mobility. Acronyms of the instruments are defined in the SI.
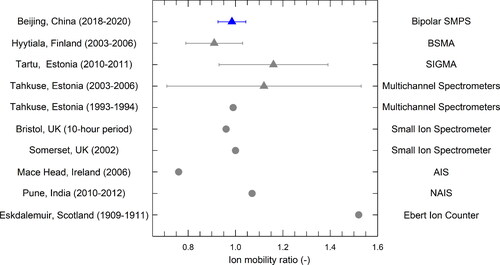
Figure 4. Size distributions of atmospheric aerosols for seven consecutive days measured at BUCT site by (a) the bipolar SMPS using natural air ions and (b) the conventional SMPS using SXR neutralizer. Integrated number concentrations in the size range of (c) 13–25 nm, (d) 25–100 nm, (e) 100–690 nm, (f) 13–690 nm, as well as (g) geometric mean diameter and (h) geometric standard deviation of measured size distributions are shown. The time resolution for the measured size distribution and thus the calculated parameters is 5 min. On 28 January, 1 February, and 3 February, there were new particle formation events.
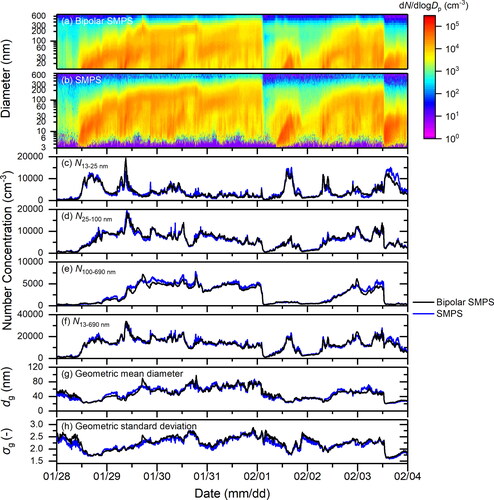
Figure 5. Comparing size distributions of atmospheric aerosols for 30 days measured at BUCT site by the bipolar SMPS using natural air ions and the conventional SMPS using SXR neutralizer. Integrated number concentrations in the size range of (a) 13–25 nm, (b) 25–100 nm, (c) 100–690 nm, (d) 13–690 nm, as well as (e) geometric mean diameter and (f) geometric standard deviation of measured size distributions are shown. The time resolution for the data is 5 min. There were 8 days with new particle formation events. Data points during new particle formation period are shown in circles (red) while the others are shown in squares (black). The dash lines are for guiding the eyes.
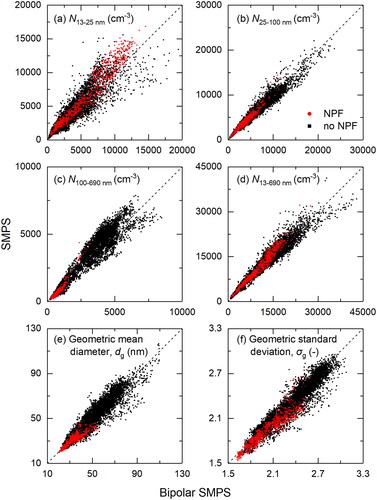
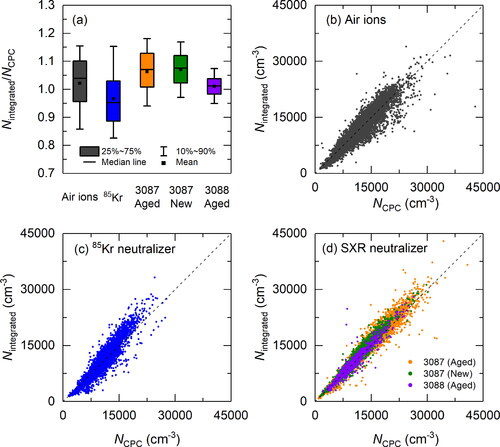
Figure 6. (a) The ratio of total particle number concentration integrated from the PNSDs measured by the bipolar SMPS (Nintegrated) to that directly measured by the CPC (NCPC) at Tsinghua site. Scatter plots show data measured using (b) natural air ions, (c) 85Kr neutralizer, and (d) SXR neutralizers. The time resolution for the data is 5 min. The dash lines are for guiding the eyes.