
Figures & data
Figure 1. Schematic of the Versatile Aerosol Concentration Enrichment System (VACES).
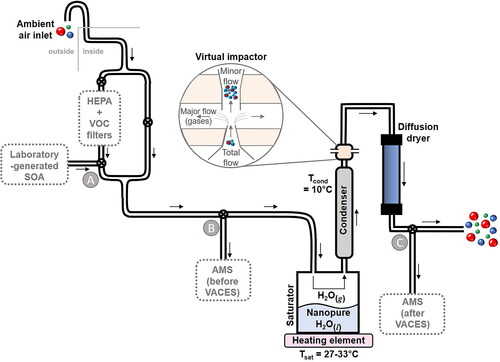
Figure 2. AMS size distributions of SOA particles generated from α-pinene ozonolysis introduced before (grey lines) and measured after the VACES (black lines) and size-dependent EFmass (circles). The dashed line shows the average EFmass for (a) Expt. 1, 17.7 (EFtheor = 20) and (b) Expt. 2, 13.8 (EFtheor = 15).
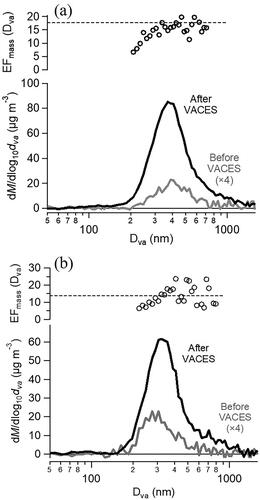
Table 1. Size distribution, enrichment, and elemental composition data for SOA particles from AMS.
Figure 3. (a, b) Difference mass spectra of SOA before and after the VACES. Each spectrum is the difference between after the VACES divided by its EFmass and before the VACES. Positive peaks at m/z > 150 show gain in HMW compounds after the VACES; (c, d) Difference mass spectra expressed as a percentage relative to the initial mass spectrum. The HMW increases after the VACES are statistically significant from those before the VACES (p < 0.05).
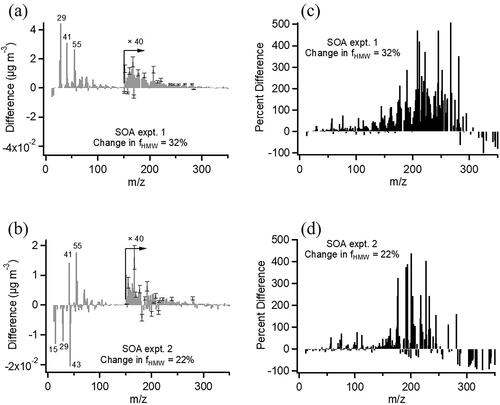
Figure 4. Fraction of high molecular weight fragments, fHMW, before and after the VACES for the two α-pinene SOA experiments with a 22–32% increase after the VACES. Error bars represent 2 s uncertainty of each measurement over 20–40 min. No significant change occurred after 2 hrs. of aging. Asterisks indicate values are statistically different (p < 0.05) from the corresponding value before the VACES.
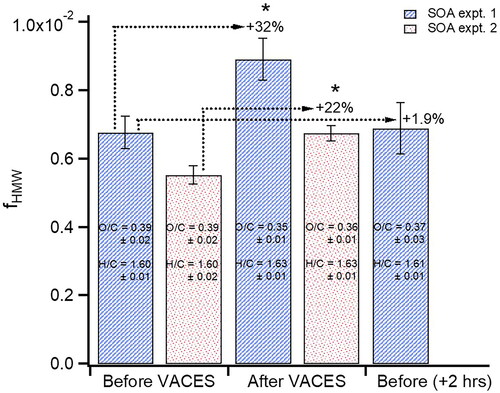
Figure 5. (a–c) Size distributions of ambient particles for three typical sampling periods before (light colors) and after the VACES (dark colors). (Green = organics, red = sulfate, blue = nitrate, pink = chloride.).
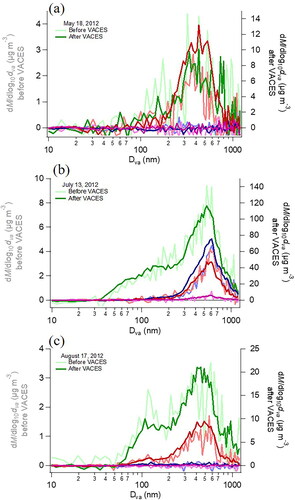
Figure 6. Organic mass concentration ratios (EquationEquation (1)(1)
(1) ) after VACES enrichment versus (a) O/C of ambient particles (b) OSc of ambient particles and (c) H/C of ambient particles for Period 1 (Spring/Summer, circles, EFtheor = 15) and Period 2 (Summer/Fall, diamonds, EFtheor = 10). SOA data are included (asterisks). Data points are colored by their measured ambient organic mass concentrations.
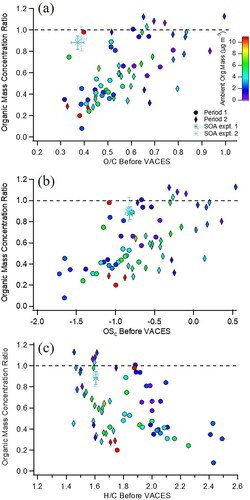
Figure 7. (a–c) Difference mass spectra for ambient particles for three typical sampling periods. Each spectrum is the difference between after the VACES divided by its EFmass and before the VACES. Positive peaks at m/z > 150 show gain in HMW compounds after the VACES and negative peaks show loss after the VACES. (d–f) The difference mass spectra expressed as a percentage relative to the initial mass spectrum.
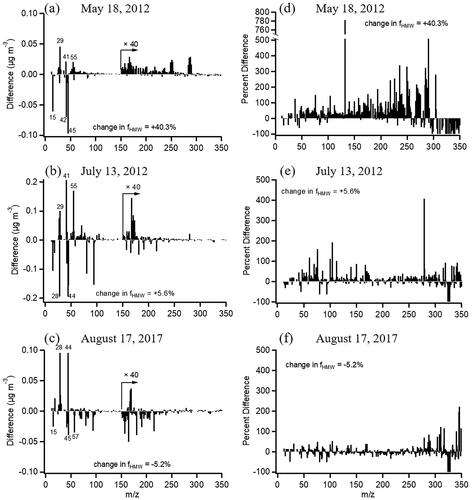
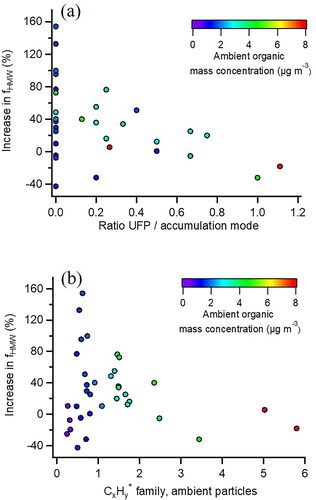
Figure 8. Change in fHMW after VACES for ambient particles (a) as a function of ratio of UFP to accumulation mode mass (b) as a function of CxHy+ composition of ambient particles. Data points are colored by the mass concentration of organics of ambient (unconcentrated) particles before the VACES.
Supplemental Material
Download PDF (281.2 KB)Data availability statement
The data that support the findings of this study are archived and openly available at http://doi.org/10.7280/D1VH7W.