Figures & data
Figure 1. Experimental set up.
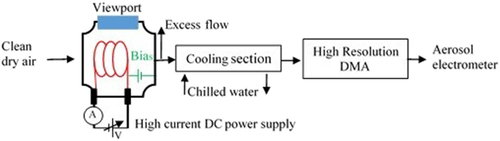
Figure 2. Views of the wire at different unknown temperatures.
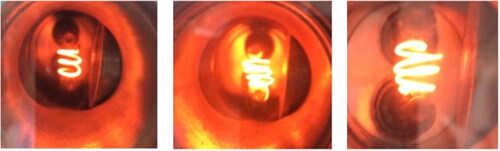
Figure 3. Effect of the temperature on the size distributions of positive singly self-charged particles generated by a heated wire (0.5 mm diameter) in 6 lpm air flowrate.
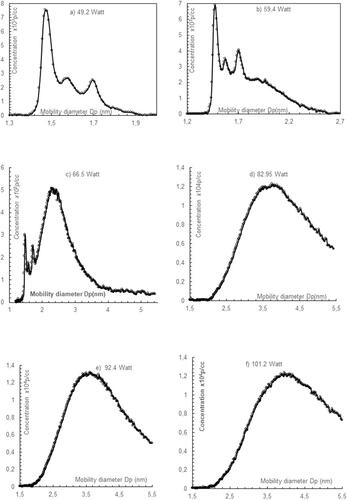
Figure 4. Effect of the temperature on the size distributions of negative singly self-charged particles generated by a heated wire (0.5 mm diameter) in 25 lpm air flowrate.
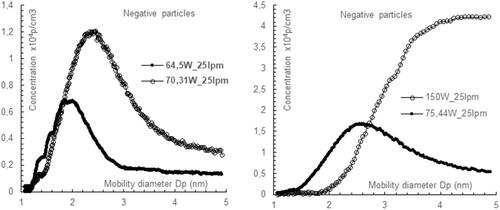
Figure 5. Views of the deposited salt on the thick electrodes of the high current feedthrough of the cross.
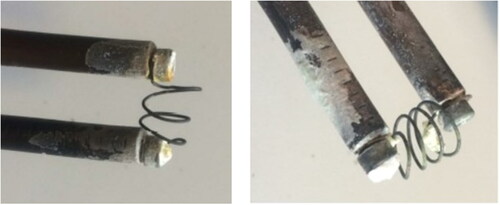
Figure 6. Positive and negative sodium chloride (NaCl+ and NaCl-) size distributions particles at two different temperatures and air flowrate.
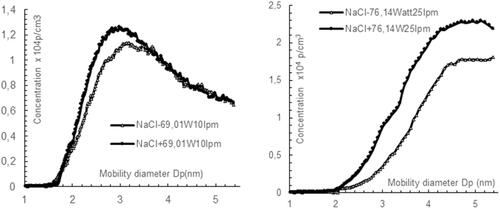
Figure 7. Positive and negative sodium chloride (KCl) size distributions particles at two different temperatures and air flowrates.
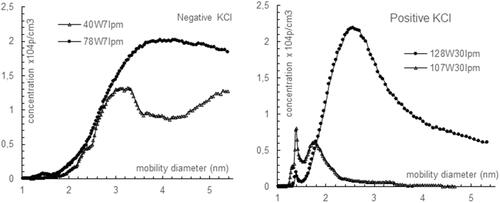
Figure 8. Effect of the voltage bias of the wire against the grounded cross body on the size distributions and total concentrations.
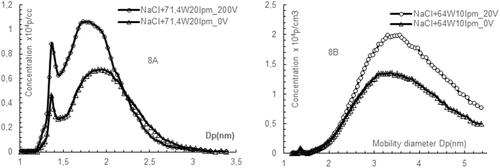
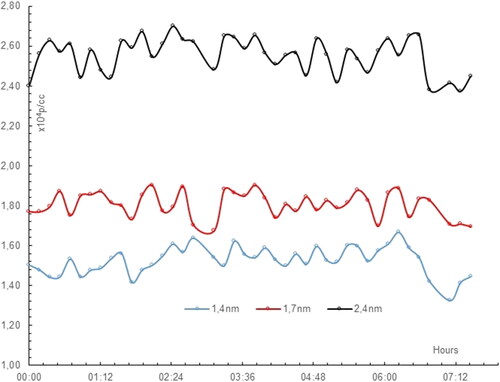
Figure 9. Evolution of the concentration of particles over the time for 3 different diameters in the sub 3 nm range.