Figures & data
Figure 1. Experimental layout, including x–y plane of room (top pane) and x–z plane of room (bottom pane); nebulizer outlet attached to tripod with outlet at x = 0.3 m, y = 0 m, z = 1.5 m. Sampling points located at intersections of all dashed lines. In the experiments including the barrier, the barrier is located at x = 0.76 m. The barrier, represented by the long-dashed line, is 0.91 m wide (centered at y = 0 m) and is 1.83 m tall (as measured from the floor).
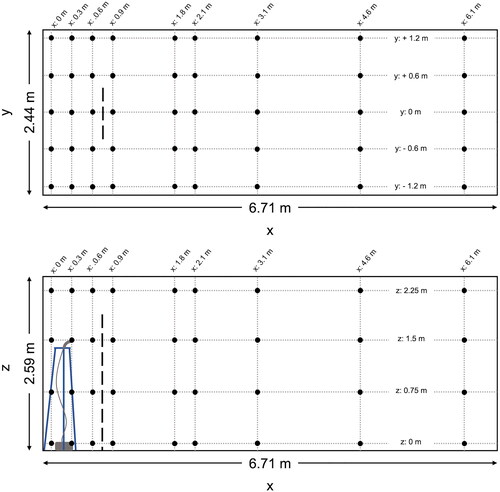
Table 1. Length of experiment (including nebulizer run time), PSL concentration in tube received from manufacturer (Polysciences, Inc, PA, USA) and volume added to nebulizer (diluted to a final volume of 5 mL in nanopure water).
Table 2. Total microsphere numbers observed (Ntot) and quantification limits for each microsphere size. Too few to count (TFTC) was set to N/Ntot = 2 × 10⁻⁴ and not detectable (ND) was set to N/Ntot = 1 × 10⁻⁴.
Table 3. List of variables used in modeling.
Figure 2. Distribution of 0.5 µm microspheres in the room with no barrier in place. (a) x–y plane at z = 0 m level; (b) x–y plane at z = 1.5 m level; and (c) x–z plane at y = 0 m level. Closed dots represent sampling points and star represents location of nebulizer outlet. N represents the total observed microspheres settled on each 25 × 75 mm microscope slide and Ntot represents the total microspheres observed on all slides during this experiment.
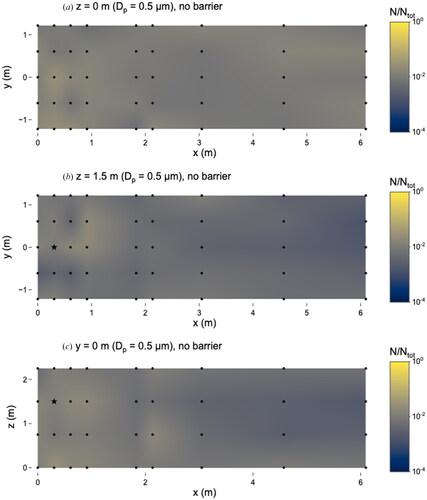
Figure 3. Distribution of 0.5 µm microspheres in the room with barrier in place. (a) x–y plane at z = 0 m level; (b) x–y plane at z = 1.5 m level; and (c) x–z plane at y = 0 m level. Closed dots represent sampling points and star represents location of nebulizer outlet. Solid line at x = 0.76 m represents location of barrier. N represents the total observed microspheres settled on each 25 × 75 mm microscope slide and Ntot represents the total microspheres observed on all slides during this experiment.
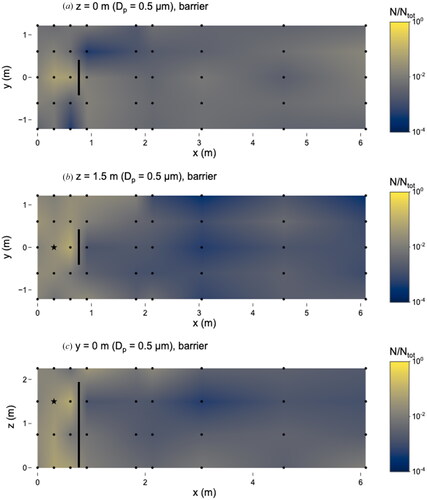
Figure 4. Distribution of 1 µm microspheres in the room with no barrier in place. (a) x–y plane at z = 0 m level; (b) x–y plane at z = 1.5 m level; and (c) x–z plane at y = 0 m level. Closed dots represent sampling points and star represents location of nebulizer outlet. N represents the total observed microspheres settled on each 25 × 75 mm microscope slide and Ntot represents the total microspheres observed on all slides during this experiment.
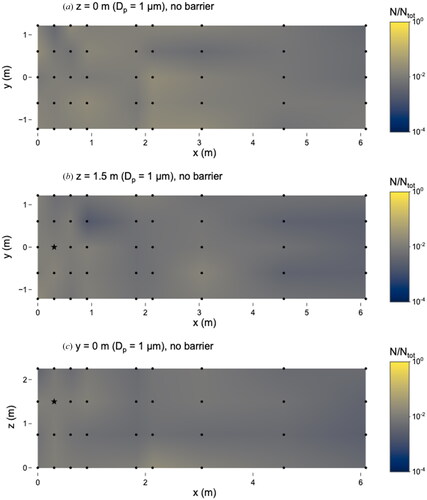
Figure 5. Distribution of 1 µm microspheres in the room with barrier in place. (a) x–y plane at z = 0 m level; (b) x–y plane at z = 1.5 m level; and (c) x–z plane at y = 0 m level. Closed dots represent sampling points and star represents location of nebulizer outlet. Solid line at x = 0.76 m represents location of barrier. N represents the total observed microspheres settled on each 25 × 75 mm microscope slide and Ntot represents the total microspheres observed on all slides during this experiment.
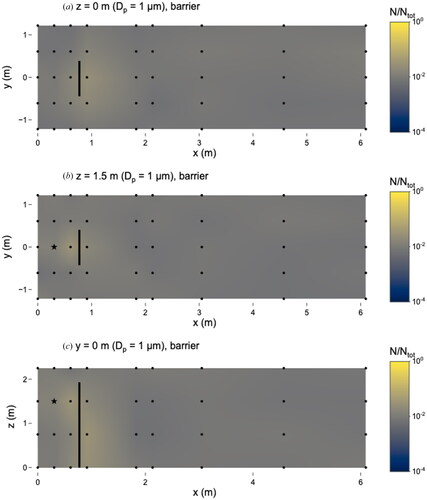
Figure 6. Distribution of 6 µm microspheres in the room with no barrier in place. (a) x–y plane at z = 0 m level; (b) x–y plane at z = 1.5 m level; and (c) x–z plane at y = 0 m level. Closed dots represent sampling points, the star represents location of nebulizer outlet, and triangles represent sampling locations that were classified as “too few to count”. N represents the total observed microspheres settled on each 25 × 75 mm microscope slide and Ntot represents the total microspheres observed on all slides during this experiment.
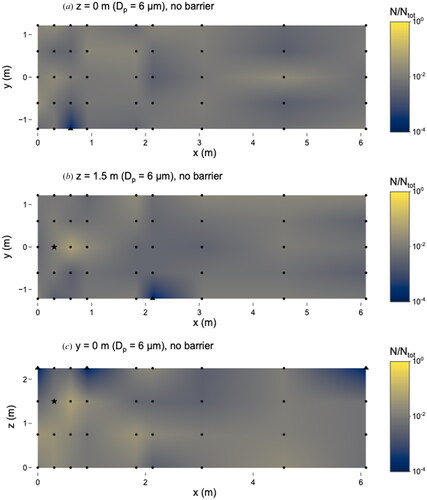
Figure 7. Distribution of 6 µm microspheres in the room with barrier in place. (a) x–y plane at z = 0 m level; (b) x–y plane at z = 1.5 m level; and (c) x–z plane at y = 0 m level. Closed dots represent sampling points, the star represents location of nebulizer outlet, and triangles represent sampling locations that were classified as “too few to count”. Solid line at x = 0.76 m represents location of barrier. N represents the total observed microspheres settled on each 25 × 75 mm microscope slide and Ntot represents the total microspheres observed on all slides during this experiment.
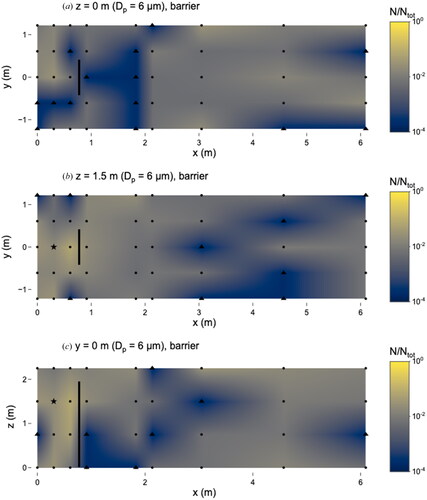
Figure 8. Distribution of 10 µm microspheres in the room with no barrier in place. (a) x–y plane at z = 0 m level; (b) x–y plane at z = 1.5 m level; and (c) x–z plane at y = 0 m level. Closed dots represent sampling points, star represents location of nebulizer outlet, triangles represent sampling locations classified as “too few to count” and x’s represent those that were classified as “not detectable”. N represents the total observed microspheres settled on each 25 × 75 mm microscope slide and Ntot represents the total microspheres observed on all slides during this experiment.
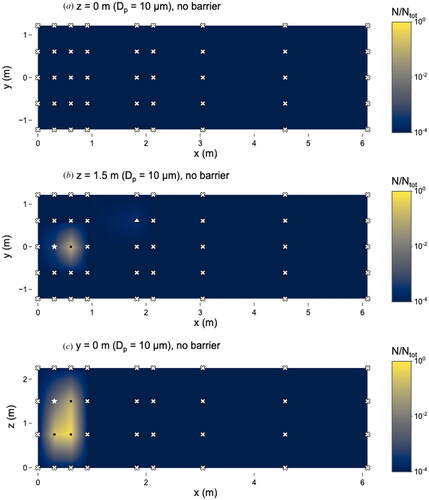
Figure 9. Distribution of 10 µm microspheres in the room with barrier in place. (a) x–y plane at z = 0 m level; (b) x–y plane at z = 1.5 m level; and (c) x–z plane at y = 0 m level. Closed dots represent sampling points, star represents location of nebulizer outlet, triangles represent sampling locations classified as “too few to count” and x’s represent those classified as “not detectable”. Solid line at x = 0.76 m represents location of barrier. N represents the total observed microspheres settled on each 25 × 75 mm microscope slide and Ntot represents the total microspheres observed on all slides during this experiment.
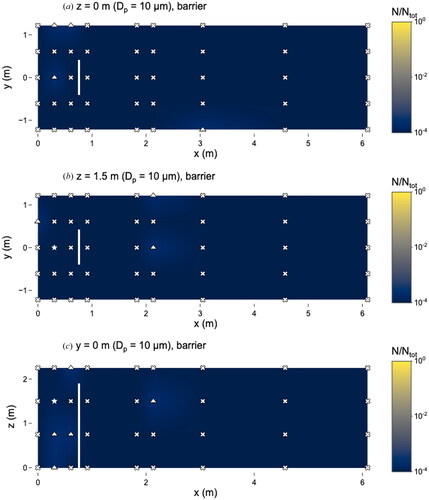
Figure 10. Distribution of 20 µm microspheres in the room with no barrier in place. (a) x–y plane at z = 0 m level; (b) x–y plane at z = 1.5 m level; and (c) x–z plane at y = 0 m level. Closed dots represent sampling points, star represents location of nebulizer outlet, triangles represent sampling locations classified as “too few to count” and x’s represent those classified as “not detectable”. N represents the total observed microspheres settled on each 25 × 75 mm microscope slide and Ntot represents the total microspheres observed on all slides during this experiment.
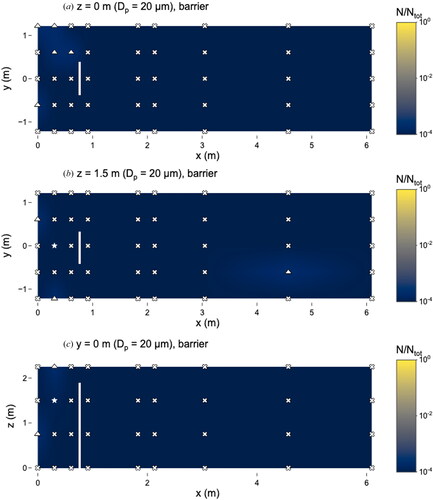
Figure 11. Distribution of 20 µm microspheres in the room with barrier in place. (a) x–y plane at z = 0 m level; (b) x–y plane at z = 1.5 m level; and (c) x–z plane at y = 0 m level. Closed dots represent sampling points, star represents location of nebulizer outlet, triangles represent sampling locations classified as “too few to count” and x’s represent those classified as “not detectable”. Solid line at x = 0.76 m represents location of barrier. N represents the total observed microspheres settled on each 25 × 75 mm microscope slide and Ntot represents the total microspheres observed on all slides during this experiment.