Figures & data
Figure 1. Schematic diagram of the experimental setup for evaluating the dispersion efficiency of polystyrene latex (PSL) particles. PSL particles collected on a polycarbonate filter were dispersed in water and measured with a single-particle extinction and scattering (SPES) instrument. SG, silica gel; HEPA filter, high-efficiency particulate air filter; MFC, mass flow controller; OPS, Optical Particle Sizer; LPM, liter per minute.
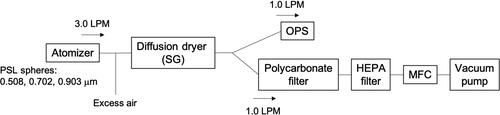
Figure 2. Effective detection area of the single-particle extinction and scattering (SPES) instrument. The dashed line indicates the mean value for polystyrene latex (PSL) particles with diameters of 0.508, 0.702, and 0.903 µm.
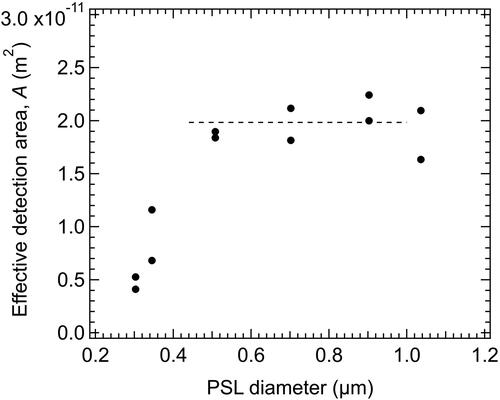
Figure 3. (a) Complex amplitude (S22) data for all particles from filter samples collected in Nagoya, Japan. The colored bar indicates the number of particles. Waveform signals for particles with [Im(S22)]sc > 2.2 were considered saturated and thus excluded from further analysis. (b) Same as (a) but expanded to show S22 data for smaller particles. (c) Data area on the S22 scatter plot for particle classification into BC-like, dust-like, and PBAP-like particles. Lines for classification are also shown in panels (a) and (b).
![Figure 3. (a) Complex amplitude (S22) data for all particles from filter samples collected in Nagoya, Japan. The colored bar indicates the number of particles. Waveform signals for particles with [Im(S22)]sc > 2.2 were considered saturated and thus excluded from further analysis. (b) Same as (a) but expanded to show S22 data for smaller particles. (c) Data area on the S22 scatter plot for particle classification into BC-like, dust-like, and PBAP-like particles. Lines for classification are also shown in panels (a) and (b).](/cms/asset/0ba5aac2-760c-4619-accc-f79299e28dcb/uast_a_2223387_f0003_c.jpg)
Figure 4. Time series of the number concentrations of (a) BC-like particles measured by single-particle extinction and scattering (SPES) instrument and refractory BC particles measured by Single Particle Soot Photometer (SP2), (b) dust-like particles by SPES instrument and coarse particles measured by Optical Particle Sizer (OPS), and (c) PBAP-like particles measured by SPES instrument and type-C fluorescent particles measured by Wideband Integrated Bioaerosol Sensor (WIBS) in ambient air sampled in Nagoya, Japan. Time series of 1-h averaged data are shown for the data obtained from online instruments (SP2, OPS, and WIBS).
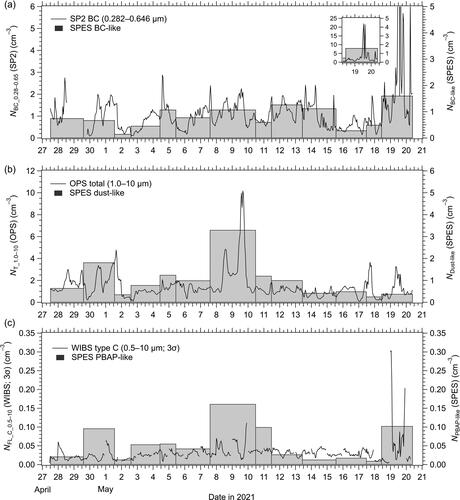
Figure 5. Scatter plots of the number concentrations of (a) BC-like particles measured by single-particle extinction and scattering (SPES) and refractory BC particles measured by Single Particle Soot Photometer (SP2), (b) BC-like particles measured by SPES and refractory BC particles measured by SP2 (both diameter ranges of 0.28–0.65 µm), (c) dust-like particles measured by SPES and coarse particles by Optical Particle Sizer (OPS), and (d) PBAP-like particles measured by SPES and type-C fluorescent particles by Wideband Integrated Bioaerosol Sensor (WIBS) in Nagoya, Japan. The arrows in panels (a) and (b) indicate local pollution event data.
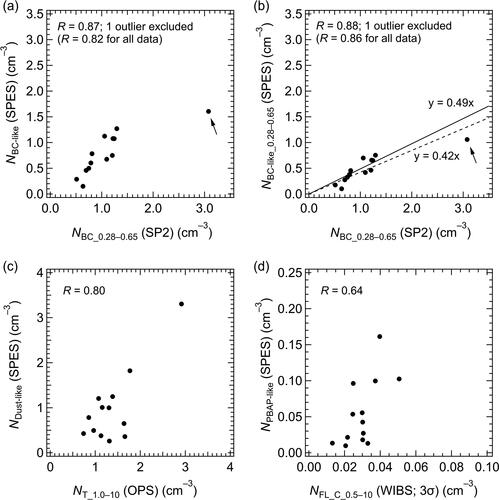
Figure 6. Correlation matrix for the number concentration of various particles measured in Nagoya, Japan. Parameter definitions are provided in the Nomenclature section of the main text. For readability, the symbol N, which denotes number concentration in the main text, is omitted here, and “Total” rather than “T” is used to represent OPS data.
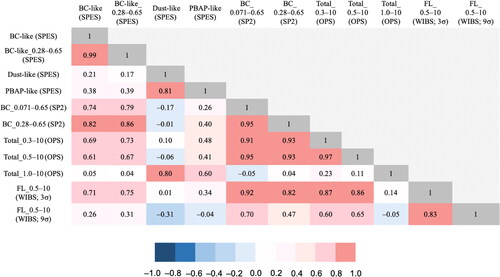
Figure 7. Scanning electron microscopy with energy dispersive X-ray spectrometry mapping images of aerosols collected in Nagoya during (a) 7–10 May and (b) 13–15 May 2021. Elemental mappings for Si and Al are shown in the right column.
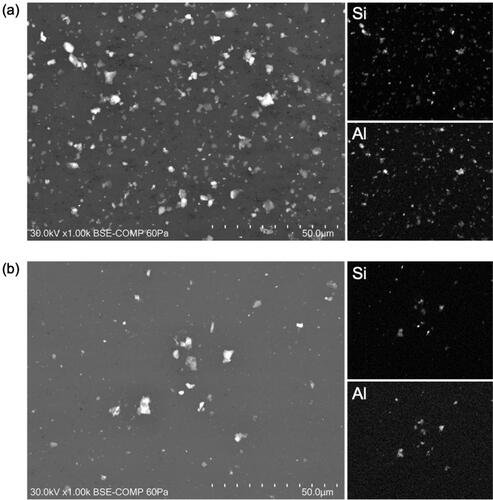
Figure A1. (a) Theoretical S22 values for spheres and fractal-like aggregates. The fractal dimension is denoted as Df. Assumed complex refractive indices at the wavelength of 632.8 nm are shown in parentheses. Volume equivalent diameters for some data points are also shown. (b) Experimental S22 values for fullerene soot, Arizona test dust, and Snomax particles. (c) Experimental and theoretical S22 values for polystyrene latex spheres (mean diameters of 0.508, 0.702, and 0.903 μm). The gray dots indicate single-particle measurement data. The solid black circles with bars indicate the median and 25th–75th percentile ranges of single-particle data for each particle size. The solid red circles with bars indicate the theoretical values and their uncertainty ranges calculated from the expanded uncertainties (k = 2) specified in the sample datasheets.
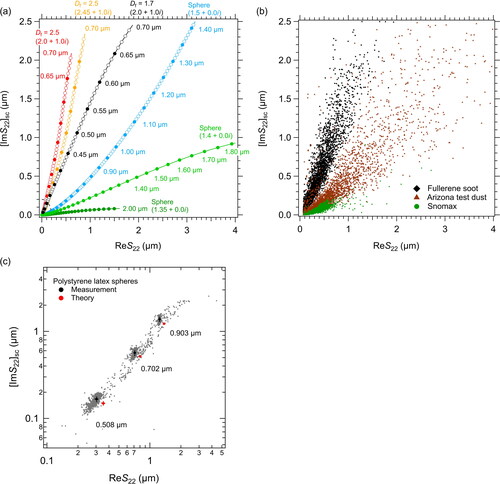
Figure A2. (a) S22 data obtained for ambient particles collected in Nagoya, Japan (gray). Color markers indicate theoretical S22 values for spheres and fractal-like aggregates with assumed refractive indices. Volume equivalent diameters for some data points are also shown. Open circles and solid triangles indicate data points every 10 nm and 50 nm, respectively. (b) Same as (a) but expanded to show S22 data for smaller particles.
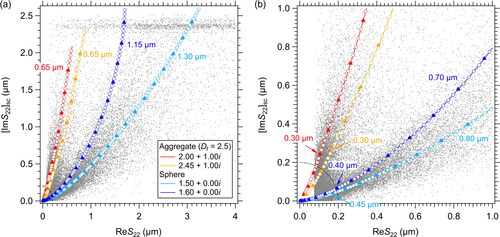
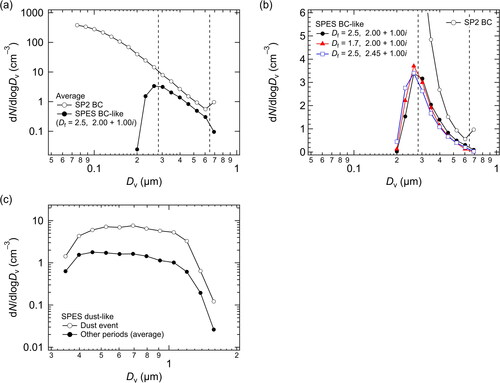
Figure A3. (a) Average number size distribution of BC measured by Single Particle Soot Photometer (SP2) and that of BC-like particles measured by single-particle extinction and scattering (SPES). For the SPES data, a fractal dimension (Df) of 2.5 and a refractive index of 2.00 + 1.00i at a wavelength of 632.8 nm were assumed. The dashed lines indicate the diameter range where the effective detection area of the SPES instrument is considered constant. (b) Same as (a) but with different assumptions of the physical properties of BC-like particles and vertical axis with a linear scale. (c) Number size distribution of dust-like particles measured by SPES during the dust event and the other periods (average).