Figures & data
Figure 1. Schematic of the microfluidic device showing (a) the view of all wells as well as the inlet and outlet channels, and (b) detail of one well with relevant dimensions.
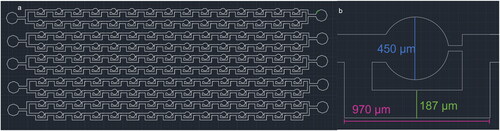
Figure 2. (a) Simplified schematic of large well array device showing thermocouple channels (not to scale). (b) Similar design by Brubaker et al. (Citation2020) for a 720 well device (Brubaker et al. Citation2020).
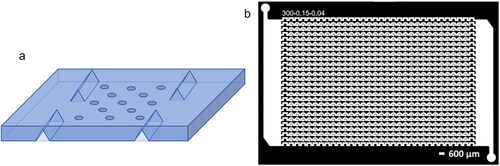
Table 1. Ingredients of each mixture.
Figure 3. Ice nucleating active site density, or ηm, for our microfluidic device compared to several sets of literature values (Wex et al. Citation2015; Polen, Lawlis, and Sullivan Citation2016; Brubaker et al. Citation2020; Roy, House, et al. Citation2021). Horizontal error bars represent uncertainty in the temperature measurement of our device.
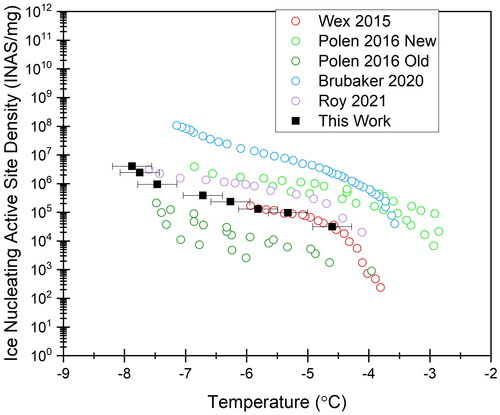
Figure 4. (a) Frozen fraction versus temperature and (b) INAS versus temperature for 1 M NaCl and 0.03 mg/mL Snomax (red circles), 5.25:1 Mix and 0.03 mg/mL Snomax (purple squares), and 1 M CaCl2 and 0.03 mg/mL Snomax (blue triangles) with heat treatments applied. Crosses on plot (a) indicate the background freezing curve of pure water for these samples.
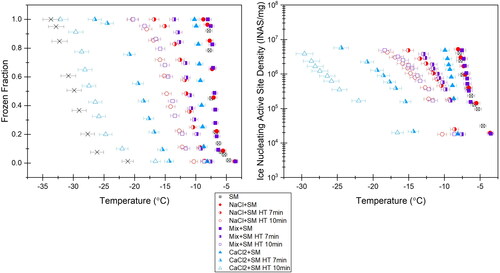
Figure 5. Example images of each particle category. The categories are as follows: Single crystals (a) with aggregate and (b) without aggregate, (c) fractal, (d) and (e) fully aggregate clusters, and (f) amorphous.
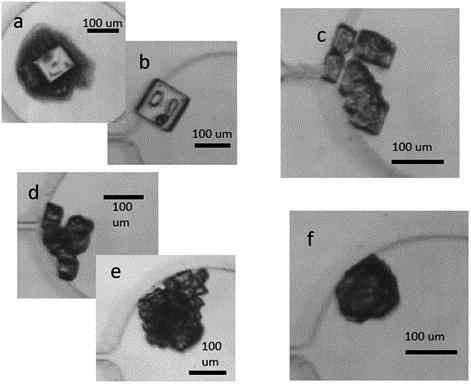
Figure 6. Charts showing the fraction of each particle type for (a) 1 M NaCl and (b) 5.25:1 Mix. The ± 4% error bars represent the average deviation in value between two different devices containing the same mixture. Crosshatches in single category in (b) represent aggregate surrounding the single particle, which was found in all single particles in the 5.25:1 Mix.
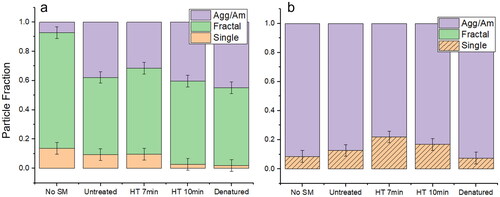
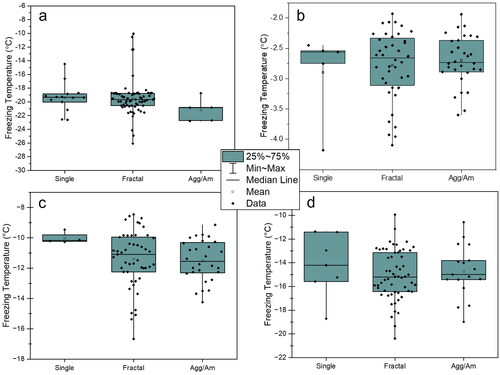
Figure 7. The particle distributions and their mean and median freezing temperatures for (a) 1 M NaCl, (b) 1 M NaCl, 0.03 mg/mL Snomax, (c) 1 M NaCl, 0.03 mg/mL Snomax heat treated for 7 min, and (d) 1 M NaCl, 0.03 mg/mL Snomax heat treated for 10 min.