
Figures & data
Figure 1. The CCN activation of PVC (open squares), PET (pink triangles), LDPE (open circles) and cellulose (green triangles). The solid lines are the traditional Köhler theory predictions that assume complete dissolution of the aerosol in the droplet growth mechanism. The solid red line is representative of inorganic ammonium sulfate with (Kreidenweis and Asa-Awuku Citation2013; Petters and Kreidenweis Citation2007). The solid black line (
) is the CCN activity prediction of a polymer with molecular weight of 100,000 g mol−1. The CCN activity of LDPE, PET and PVC is noticeably more hygroscopic than measured cellulose particles or the predicted polymeric material (solid black line).
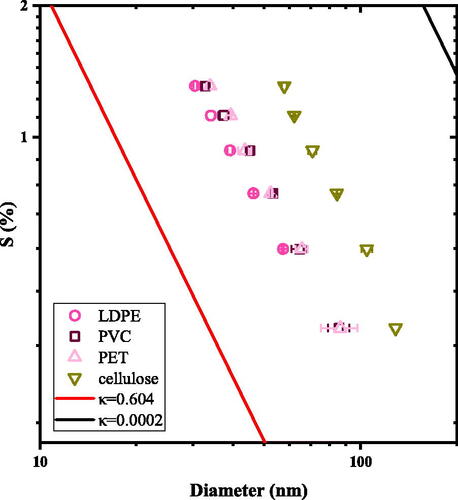
Figure 2. The hygroscopicity of LDPE (open circle), PET (pink triangle), PVC (open square) and cellulose (green triangle) derived from S-D measurement using (a) traditional hygroscopicity theory (b) FHK (c) FHH-AT. Symbols are derived from data presented in . Solid lines are respective predictions of hygroscopicity assuming different mechanisms.
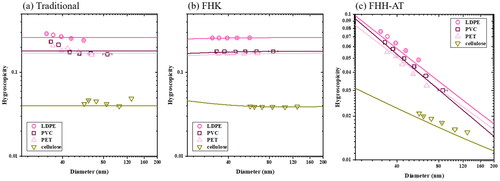
Table 1. Particle hygroscopicity and fitting parameters of LDPE, PET, PET and cellulose.
Supplemental Material
Download MS Word (1.1 MB)Data availability statement
Data will be made available upon request.