2,003
Views
33
CrossRef citations to date
0
Altmetric
Original Articles

Quantification of Airborne Mycobacterium tuberculosis in Health Care Setting Using Real-Time qPCR Coupled to an Air-Sampling Filter Method

&
Pages 371-376 | Received 09 Sep 2004, Accepted 24 Feb 2005, Published online: 23 Feb 2007

Figures & data

Table 1 Tuberculosis patients characteristics and airborne M. tuberculosis concentrations

Figure 1 Calibration curve of known M. tuberculosis DNA concentrations and threshold cycle (Ct) by real-time qPCR assay.
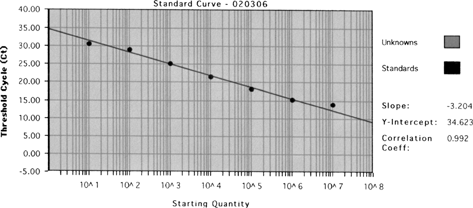
Figure 1 Calibration curve of known M. tuberculosis DNA concentrations and threshold cycle (Ct) by real-time qPCR assay.

Figure 2 (a) Correlation between airborne M. tuberculosis levels and sputum smear results. −, No colony growth; +, < 50 CFU/plate; ++, 50–100 CFU/plate; +++, 100–200 CFU/plate. (b). Correlation between airborne M. tuberculosis levels and sputum culture results. +, 1–3 per slide; ++, 1–9 per 10 field; +++, 1–9 per field; ++++.
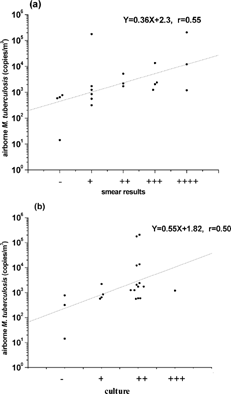
Figure 2 (a) Correlation between airborne M. tuberculosis levels and sputum smear results. −, No colony growth; +, < 50 CFU/plate; ++, 50–100 CFU/plate; +++, 100–200 CFU/plate. (b). Correlation between airborne M. tuberculosis levels and sputum culture results. +, 1–3 per slide; ++, 1–9 per 10 field; +++, 1–9 per field; ++++.

Reprints and Corporate Permissions

Please note: Selecting permissions does not provide access to the full text of the article, please see our help page How do I view content?

To request a reprint or corporate permissions for this article, please click on the relevant link below:

Academic Permissions

Please note: Selecting permissions does not provide access to the full text of the article, please see our help page How do I view content?

Obtain permissions instantly via Rightslink by clicking on the button below:

If you are unable to obtain permissions via Rightslink, please complete and submit this Permissions form. For more information, please visit our Permissions help page.