Figures & data
Figure 1. Regional areas included in the NCFSM.
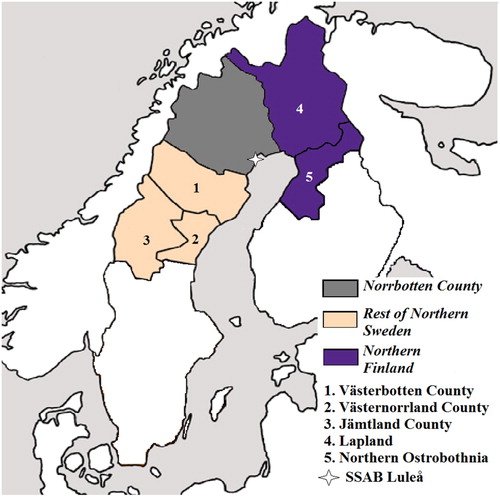
Figure 2. NCFSM flow chart.
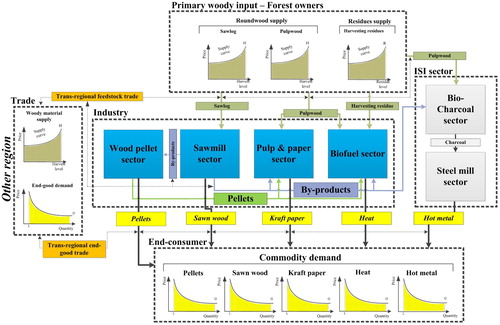
Figure 3. ISI production at different price-levels for hot metal.
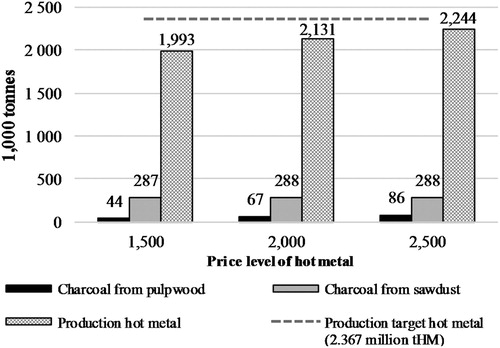
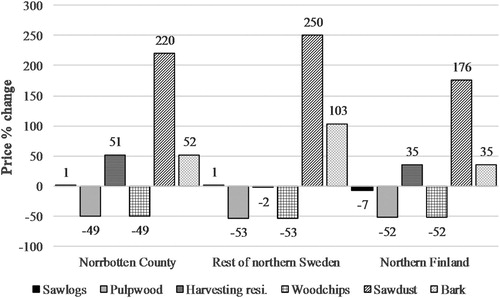
Figure 4. Regional price development for woody materials at different hot metal prices.
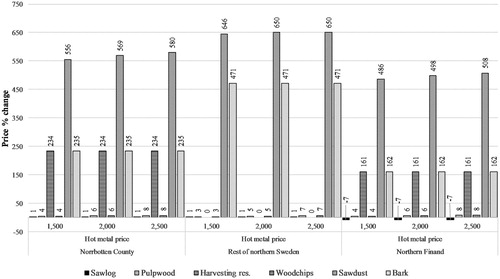
Figure 5. Changes to end-good consumption at partial transition to charcoal.
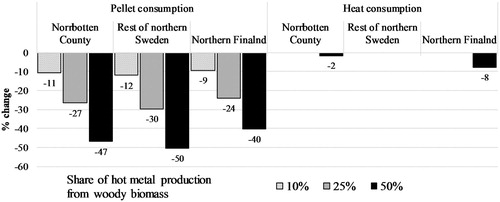
Figure 6. Regional price development for woody materials at partial transition to charcoal.
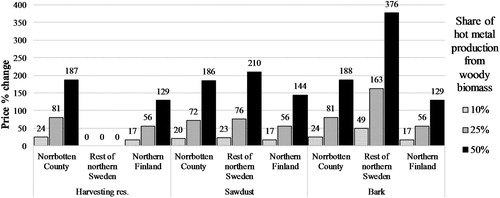
Figure 7. Changes in regional harvest rate from increased potential roundwood supply.
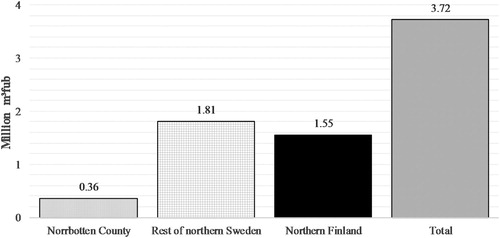
Figure 8. Regional price development from increased roundwood supply.