
Figures & data
Figure 1. Location of the study area.
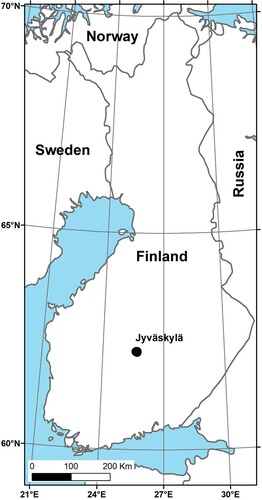
Table 1. Average stand characteristics of the study area in Jyväskylä.
Table 2. Costs and maximum traversing distances for forests and other habitats used in Least Cost Path (LCP) analysis.
Table 3. Forest management scenarios with stand characteristics, connectivity criteria and actions allowed.
Figure 2. Overview of dataset, indexes, simulations, and optimization procedure to construct management scenarios. Applied software presented in blue font. ArcGIS Desktop 10.6.1 (ESRI Citation2018) was used in the spatial analyses and Motti Stand Simulator (Salminen et al. Citation2005; Hynynen et al. Citation2015) in the simulations. Further analyses were carried out with SAS (ver 9.4, X64_10PRO platform) and J (Lappi and Lempinen Citation2014) software.
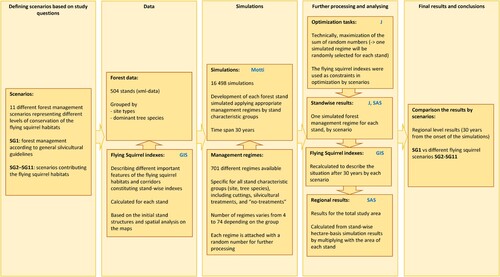
Table 4. Stumpage prices and silvicultural costs (in real terms) applied in assessing the NPV for forest management scenarios SG1-SG11.
Figure 3. Suitable SFS forests (dark colour) and corridors (lines) associated with management scenario SG1 (a) and SG11 (b) after a 30 year-period.
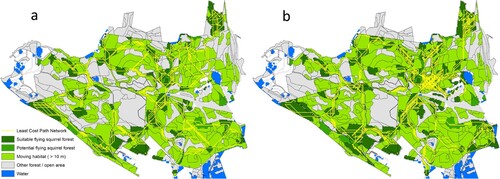
Table 5. Average stocking and volumes of birches and aspen and total number of connections associated with forest management scenarios.
Figure 4. Net Present Values (NPV) associated with forest management scenarios SG1-SG11, when 2% and 4% interest rates applied.
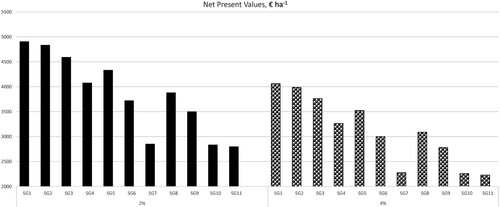
Table 6. Cost of an additional hectare suitable for SFS, € ha−1.
Table 7. Cost of an additional hectare suitable for SFS, € ha−1 when adjusted cutting removals applied.