Figures & data
Table 1. Patient characteristics.
Figure 1. (a) Frequency of the selected library plans during the course of treatment for each patient. The number on top of each bar represents the number of available library plans and the character in the figure (P; S) represents the used treatment position (prone; supine). (b) Average percentage of selected library plans during the course of treatment for both the prone and supine treatment position. The number on top of each bar represents the number of available library plans.
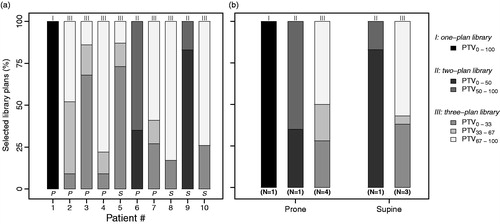
Figure 2. For patient 3, DVHs of recalculated fraction dose distributions are shown for target volumes (CTV, pCTV) and OARs (bladder, bladder wall, rectum, bowel cavity) based on the non-adaptive (non-ART; solid lines (red)) and adaptive (ART; dotted lines (blue)) treatment strategy. The intersection of the 2 thin solid lines (black) in the DVHs for target structures indicates V95% = 98%.
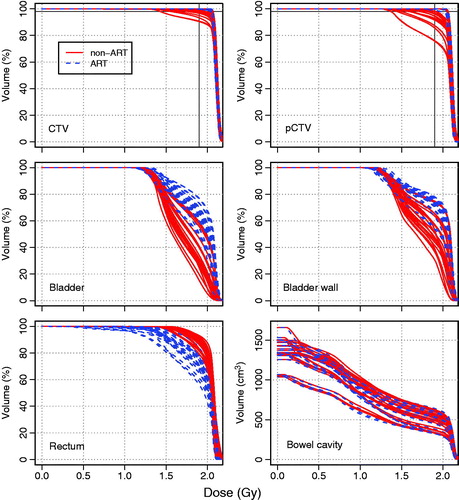
Figure 3. Overall and patient-specific results of the recalculated fraction dose distributions based on the primary CTV (upper) and the CTV (lower), with the dotted gray horizontal lines indicating 95% and 107% of the prescribed fraction dose. (a,b) The boxplots of daily dose parameters over all analyzed fractions of all included patients are shown for both the non-adaptive (non-ART) and the adaptive (ART) strategy. Boxes represent upper and lower quartiles (IQR), the band inside the box the median value and the whiskers the highest (lowest) value within 1.5 IQR of the upper (lower) quartile. Horizontal lines including an asterisk indicate statistical significant difference (p < 0.01). (c,d) Patient-specific coverage of the primary CTV and CTV (D98%) for all analyzed fractions are shown for both the non-ART and ART strategy.
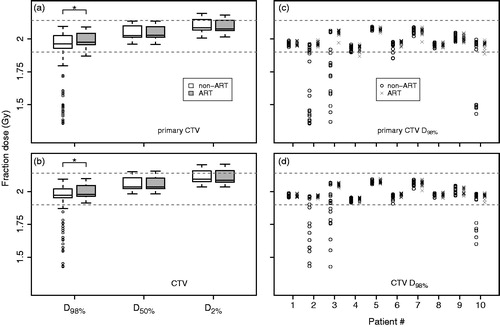
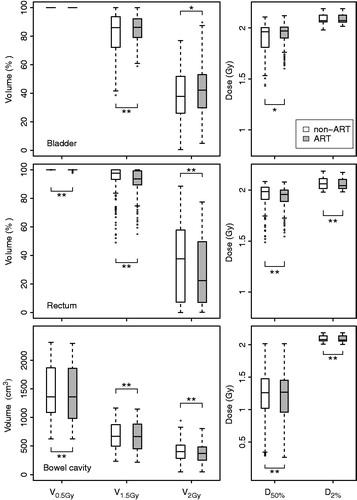
Figure 4. For the non-adaptive (non-ART) and adaptive (ART) strategy, boxplots of fraction DVH parameters over all analyzed fractions of all patients are shown for bladder (upper), rectum (middle) and bowel cavity (lower). For the meaning of box, whiskers and dots: see Figure 3. Horizontal lines including asterisks indicate statistical significant difference (*p < 0.05; **p < 0.01).