
Figures & data
Table 1. Patient overview and relevant information.
Figure 1. Example of the procedure how a fractional computed tomography (fCT) was made. (a) The original planning CT (pCT) with gas pocket delineations. (b) The gas pockets in the pCT were filled with soft-tissue density. (c) One cone-beam CT (CBCT) with gas pocket delineations. (d) Gas pockets in the CBCT were overlaid on the pCT with filled gas pockets in (b), yielding the fCT. CTV: clinical target volume; PTV: planning target volume.
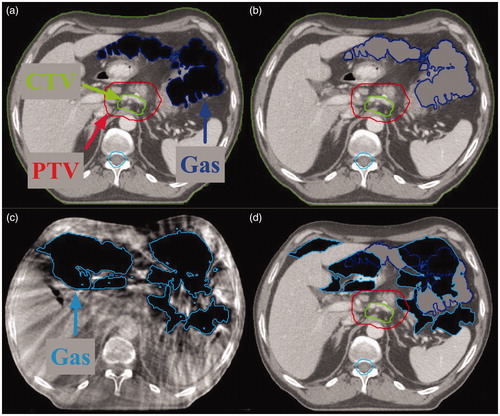
Figure 2. Gas volume for all nine patients over the whole treatment course. Day 0 denotes the day that the planning computed tomography (CT) scan was acquired.
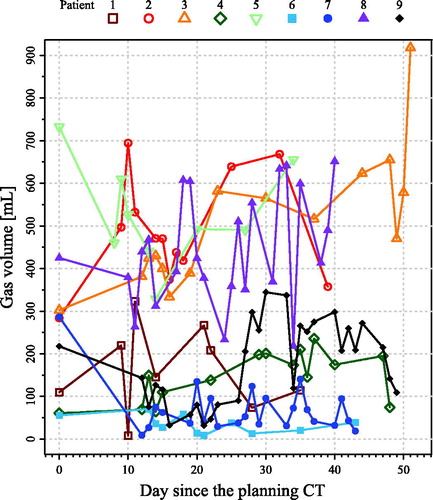
Figure 3. The minimum and maximum dose differences in the clinical target volume (CTV) between the fractional doses and the planned doses per fraction against the gas volume difference relative to the initial gas volume for both intensity-modulated radiation therapy (IMRT) and volumetric-modulated arc therapy (VMAT) plans with no density override (DO). The fitting line and its 95% confidence interval are denoted as black solid line and dotted lines around it, respectively. The marginal and conditional R2, the slopes, and the intercepts derived from the linear mixed-effects model are also given.
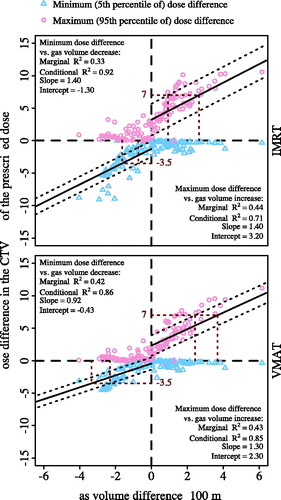
Figure 4. Relationship of the minimum dose differences between no density override (DO) and DO = 0.5 and between no DO and DO = 1, for intensity modulated radiation therapy (IMRT) and volumetric-modulated arc therapy (VMAT) planning, in the fractions with decreased gas volume relative to initial gas volume. The solid line denotes the fitting line. The marginal and conditional R2, the slopes, and the intercepts derived from the linear mixed-effects model are also given.
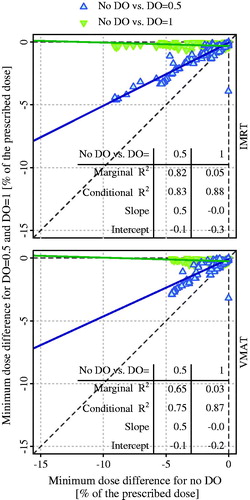
Table 2. V95% and D2% of planned dose and accumulated dose in the clinical target volume.