Figures & data
Figure 1. Contrast and noise in Catphan phantom for dual energy monochromatic images at 40, 50, 60, 70, 80, 110 and 150 keV. For reference, the standard clinical value is show (horizontal full line).
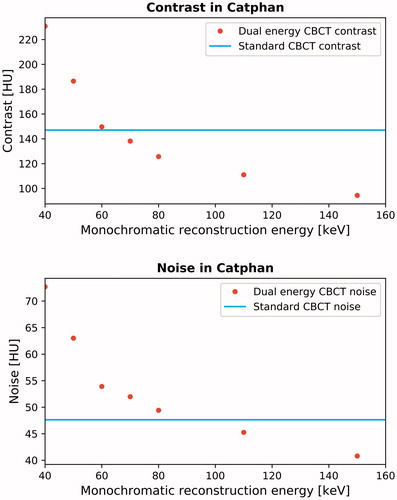
Figure 2. The effect on contrast-to-noise ratio (CNR) when using the de-noising technique on dual energy CBCTs. The red/green points are the mean CNR as a function of reconstruction energy for all patients with/without de-noising. The blue line and shaded area is the average standard CBCT CNR and standard deviation for all patients.
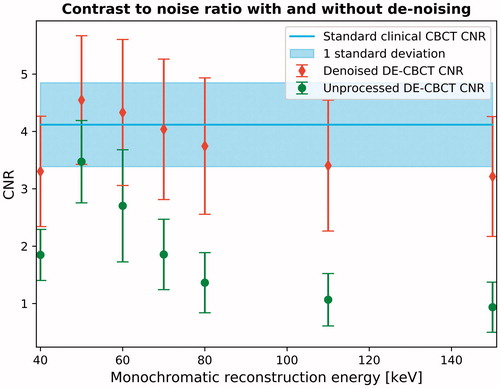
Figure 3. Example dual-energy images for one patient. The top row: 50 keV dual energy CBCT slices without (left) and with metal artifacts (right). Arrows point to areas with improved soft tissue contrast. Middle row: same as top row for 150 keV image. Arrows indicate reduced metal artifacts (black) and where new soft tissue information is uncovered (white). Bottom row: same as top row for standard clinical CBCT.
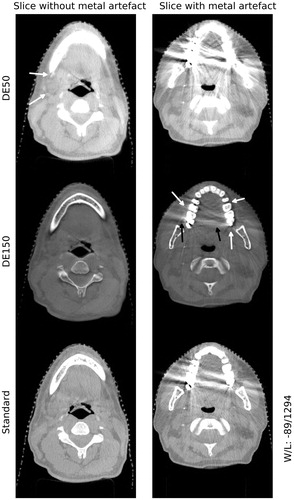
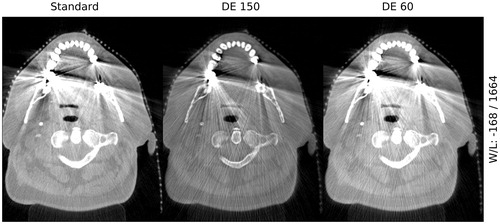
Figure 4. The impact of different reconstruction energies on metal artifacts and new artifacts in the DE images. The streaks in the DE images are seen to originate from the metal in the patient. Left: standard clinical CBCT. Middle: 150 keV DE CBCT. Right: 60 keV DE CBCT.