Figures & data
Figure 1. (A) In vitro 11C-acetate and 11C-methionine retention under various conditions, that mimics the deviant tumor microenvironment. Data are normalized to control conditions (O2 = 21%, pH = 7.4). The dotted lines indicate 75 and 125% of tracer retention under control conditions, respectively. *p < .05; †p < .001. n was 3-6 for all cell lines except for BxPC3 where it is 2. (B, C) Examples of corresponding FAZA (4 h PI) and 14C-methionine (1 h PI) autoradiograms and pimonidazole stainings for SCCVII (B) and Caski (C) tumor sections. It is evident that, 14C-methionine retention is reduced in hypoxic areas. In SCVII, which is largely non-necrotic, the spatial relationship between FAZA and 14C-methionine was analyzed by calculating Pearson’s r values from scatterplots based on a 1 × 1 mm grid covering the entire viable hypoxic area. The grid-based analysis was not performed in Caski tumors due to excessive central necrosis, resulting in few or none pixels in viable non-hypoxic tissue. However, manual delineation of viable non-hypoxic and hypoxic areas (encircled areas) guided by FAZA autoradiograms revealed that methionine retention also in this tumor model was reduced under hypoxia.
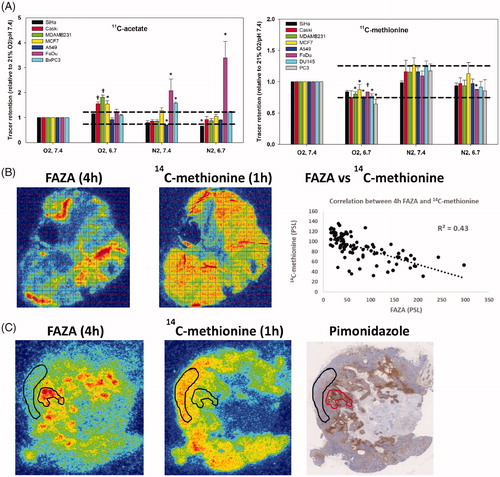
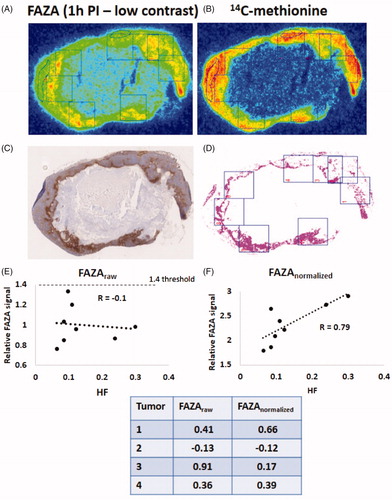
Figure 2. Example of pimonidazole maps and autoradiograms 1 h after FAZA administration (low-contrast scenario) derived from a Caski tumor. Pixels with a size of 2 x 2 mm were positioned arbitrarily on the FAZA autoradiograms (A). Pixels were next positioned similarly on the 14C-methionine (B) autoradiograms and the pimonidazole maps (C, D) to include non-hypoxic and hypoxic viable tissue and necrosis. A free-hand ROI encircling a non-hypoxic viable reference area was also included. Signals from the two tracers were determined and compared to hypoxic fraction (HF) extracted from segmented pimonidazole maps (D). HF was not corrected for necrosis and thus represents the absolute number of radioresistant hypoxic cells. (E) correlation between HF and FAZApixel-to-reference ROI signal (equals the approach used in clinical settings). (F) correlation between HF and FAZApixel-to-reference ROI signal following normalization to the respective 14C-methionine signal values in each pixel/ROI (for further explanation see materials and methods). The table insert shows the same analysis as in E and F but performed in 4 other tumors.