
Figures & data
Table 1. Information on investigated cases.
Figure 1. ΔVair extracted from the pCT and QACT in: (a) rectum; (b) small bowel; and (c) large bowel for the 17 cases. Total ΔVair is displayed in (d). Cases 1–11 are prostate cancer (prostate bed–only in cases 7 and 11); cases 12–14 are gynecologic cancer; cases 15 and 16 are colon cancer; and case 17 is embryonal rhabdomyosarcoma. For each case, air volume in the pCT is displayed in blue before the mean and SD of ΔVair in the QACTs.
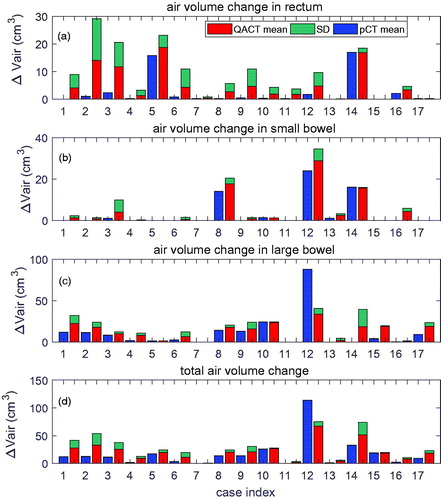
Figure 2. (a) D99% and (b)
D95% in the initial plan in all study cases; (c)
D99%; and (d) ΔD95% in the boost plan in the prostate cases. In (a) and (b), results from optimization with and without virtual CTs are displayed. “Mean_MO” and “Mean_noMO” stand for the mean value of the dose changes from the plans with and without the virtual CTs in the optimization, respectively. In (c) and (d), virtual CTs were used.
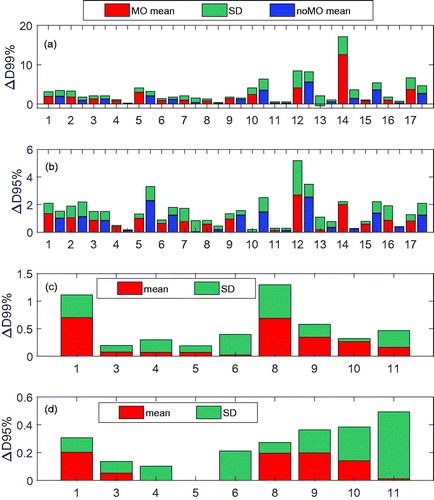
Figure 3. Registered pCT and QACT (left column), dose distribution in the pCT (middle column), and difference in doses in the pCT and QACT (right column) for cases 12 (top row), 17 (middle row), and 14 (bottom row). The CTV contour in the pCT is in solid green, and the dashed green line on the QACT was obtained by DIR. Brown = contour of air in pCT; red = contour of air in QACT.
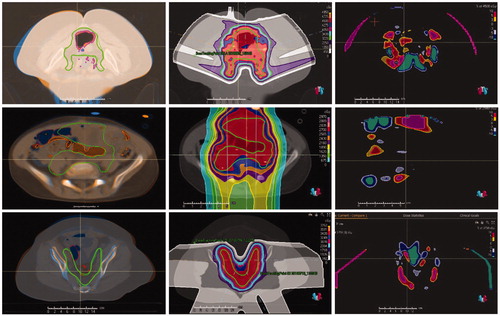
Table 2. Correlation coefficients and t-test p values between D99%,
D95%, and ΔVair in rectum, small and large bowel, and total change of air volume.