
Figures & data
Figure 1. Two examples of the Pictorial Representation of Attachment Measure (PRAM).
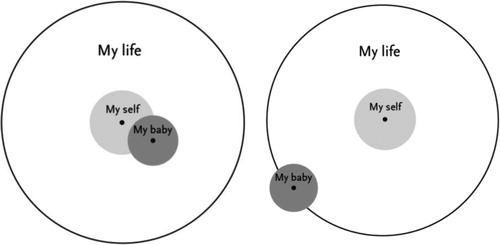
Figure 2. Flowchart. T1: 20-24 weeks of gestation. T2: gestation week 36. T3: 6 weeks postpartum. T4: 6 months postpartum.
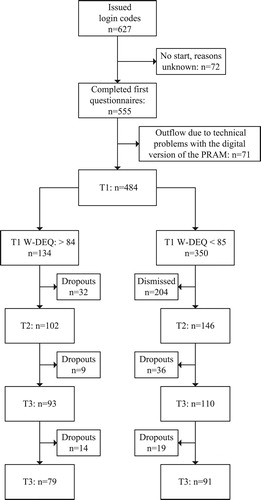
Figure 1. Two examples of the Pictorial Representation of Attachment Measure (PRAM).
Figure 2. Flowchart. T1: 20-24 weeks of gestation. T2: gestation week 36. T3: 6 weeks postpartum. T4: 6 months postpartum.