
Figures & data
Figure 1. Mean differences changes in blood pressure over time in patients with hypertension receiving a single-pill combination vs. a free combination of the same treatments from a meta-analysis. Data shown are mean treatment differences for SPC vs. free combination from a fixed effects model meta-analysis; bars are 95%CI. Negative treatment differences favour the single pill combination (SPC). Drawn from data presented in referenceCitation34.
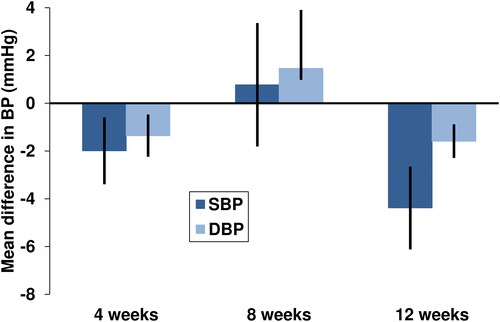
Table 1. Adherence and persistence with antihypertensive therapy with 2-agent single pill combinations (SPC) vs. the corresponding free combination (FC) from a systematic review and meta-analysis.
Figure 2. Odds of achieving good adherence and persistence with antihypertensive therapy for treatment with a single-pill combination (SPC) vs. free combination of antihypertensive agents from a meta-analysis. Data for adherence show odds ratios of achieving proportion of days covered (PDC) or medication possession ratio (MPR) ≥80% for SPC vs. free combination. Data for persistence = hazard ratios for time to a treatment gap of at least 30 or 60 days for SPC vs. free combination, or for an answer of “yes” to the question “was there a 30 day treatment gap at any time during the study?”. Drawn from data presented in referenceCitation35.
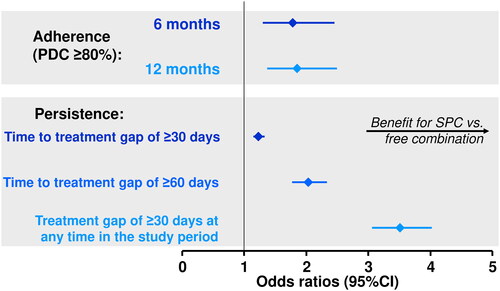
Table 2. Overview of key recommendations for the initiation of pharmacologic management of hypertension in guidelines from China, Europe and the USA and from selected global guidelines.