404
Views
2
CrossRef citations to date
0
Altmetric
Research articles

Comparative cytogenetics of North Island tree wētā in sympatry

, &
Pages 73-84 | Received 14 May 2014, Accepted 16 Feb 2015, Published online: 27 May 2015

Figures & data

Figure 1 Distributions of chromosome races for the three Hemideina tree wētā species studied here. Orange = H. thoracica, yellow = H. trewicki, purple = H. crassidens. Distributions of H. thoracica chromosome races taken from Morgan-Richards & Wallis (Citation2003). Distributions of H. crassidens chromosome races taken from Morgan-Richards (Citation2000).
Figure 2 Variation in the relative size and centromere position of mitotic chromosomes from male tree wētā (Hemideina) from four populations. A, Individual chromosomes from each of 10 mitotic cells from two individual wētā from the same population (Hawkes Bay H. thoracica). Grey or black squares represent each wētā; B, Hemideina thoracica collected from Hawkes Bay (n = 10; grey squares) and Manawatu (n = 10; black triangles), one mitotic cell per wētā; C, Hemideina thoracica (Hawkes Bay and Manawatu; grey squares and black triangles) and H. crassidens from Manawatu (n = 10; white circles); D, Hemideina thoracica (Hawkes Bay and Manawatu; squares and triangles) and H. trewicki from Hawkes Bay (n = 13; dark grey diamonds); E, Hemideina trewicki from Hawkes Bay (dark grey diamonds) and male H. crassidens from Manawatu (white circles). Smaller chromosomes where no centromere could be identified were given an arbitrary P-value of 0.1%, with total length of the chromosome being its q-value. Representative mitotic chromosomes from: F, male H. thoracica; G, male H. crassidens; H, male H. trewicki.

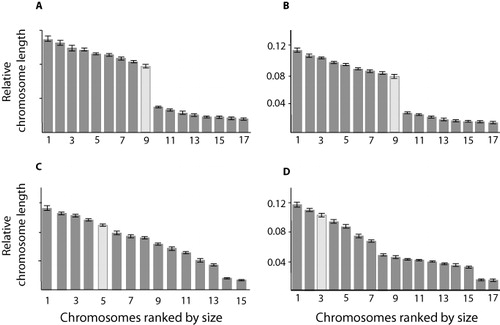
Table 1 Average relative length of each chromosome in the karyotype of Hawkes Bay male Hemideina thoracica (n = 10), and the average ratio for arm lengths (q/p) provides centromere position, and nomenclature based on Levan et al. (Citation1964). Metacentric (m 1.05–1.66); submetacentric (sm 1.67–2.99); subtelocentric (st 3.00–6.99); telocentric (t 7.00–39.00). The P-value used to assign chromosome pairs was taken from two-sample t-tests for differences between chromosomes.

Table 2 Average relative length of each chromosome in the karyotype of Manawatu male Hemideina thoracica (n = 10), and the average ratio for arm lengths (q/p) provides centromere position, and nomenclature based on Levan et al. (Citation1964). Metacentric (m 1.05–1.66); submetacentric (sm 1.67–2.99); subtelocentirc (st 3.00–6.99); telocentric (t 7.00–39.00). The P-value used to assign chromosome pairs was taken from two-sample t-tests for differences between chromosomes.

Table 3 Average relative length of each chromosome in the karyotype of Manawatu male Hemideina crassidens (n = 10), and the average ratio for arm lengths (q/p) provides centromere position, and nomenclature based on Levan et al. (Citation1964). Metacentric (m 1.05–1.66); submetacentric (sm 1.67–2.99); subtelocentirc (st = 3.00–6.99); telocentric (t 7.00–39.00). The P-value used to assign chromosome pairs was taken from two-sample t-tests for differences between chromosomes.

Figure 3 Karyotypes of four population samples of tree wētā (Hemideina), showing chromosome size relative to the entire genome length during mitosis, with standard error of the mean. One mitotic cell was used for measurements per individual, chromosomes were ranked by relative size for analysis. The putative sex chromosome in each karyotype is coloured light grey. A, Hemideina thoracica from Hawkes Bay (sample size; n = 9); B, Hemideina thoracica from Manawatu (n = 10); C, Hemideina crassidens from Manawatu (n = 10); D, H. trewicki from Hawkes Bay (n = 13).

Table 4 Average relative length of each chromosome in the karyotype of Hawkes Bay male Hemideina trewicki (n = 9), and the average ratio for arm lengths (q/p) provides centromere position, and nomenclature based on Levan et al. (Citation1964). Metacentric (m 1.05–1.66); submetacentric (sm 1.67–2.99); subtelocentirc (st 3.00–6.99); telocentric (t 7.00–39.00). The P-value used to assign chromosome pairs was taken from two-sample t-tests for differences between chromosomes.

Reprints and Corporate Permissions

Please note: Selecting permissions does not provide access to the full text of the article, please see our help page How do I view content?

To request a reprint or corporate permissions for this article, please click on the relevant link below:

Academic Permissions

Please note: Selecting permissions does not provide access to the full text of the article, please see our help page How do I view content?

Obtain permissions instantly via Rightslink by clicking on the button below:

If you are unable to obtain permissions via Rightslink, please complete and submit this Permissions form. For more information, please visit our Permissions help page.