
Figures & data
Figure 1. True population mean height, velocity and acceleration.
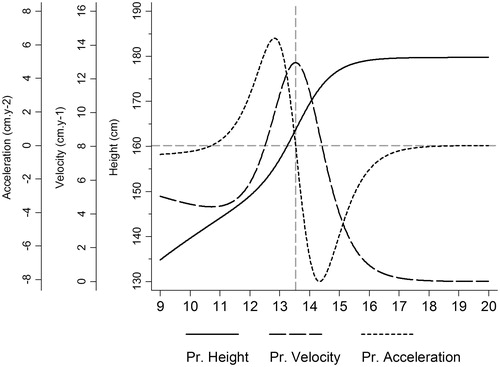
Table 1. Experimental parameters and rationale used in the simulation study.
Figure 2. Mean bias with interquartile range and 95% range of bias for the Preece & Baines, multi-level models-fractional polynomial (MLM-FP), superimposition by translation and rotation (SITAR) and principal components analysis through conditional expectation (PACE) methods used to estimate age at PHV across different experimental scenarios.
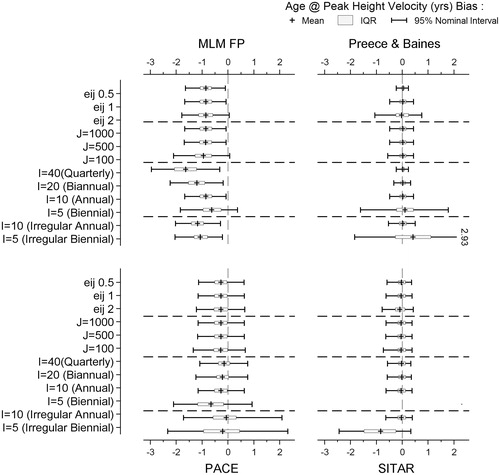
Table 2. Non-convergence rates of the central difference, Preece & Baines, MLM-FP, SITAR and PACE methods used to estimate age at peak height velocity across different experimental scenarios.
Table 3. Spearman’s rank correlation between the true age at PHV and the age at PHV estimated using the central difference, MLM FP, SITAR and PACE methods across different simulated scenarios.
Table 4. Bias in height at PHV using the Preece & Baines, MLM FP, SITAR and PACE methods across different simulated scenarios.
Table 5. Average age at PHV for the Christ’s Hospital school data, with Pearson’s correlation coefficients between estimated age at PHV from each pair of methods.
Table 6. Pearson correlation coefficients between estimated age at PHV in the simulation study.