
Figures & data
Figure 1. Lexis diagram for the Harpenden Growth Study, showing the ages and dates of measurement for 701 children. Each line represents one child, with their first (□) and last (▪) measurements marked.
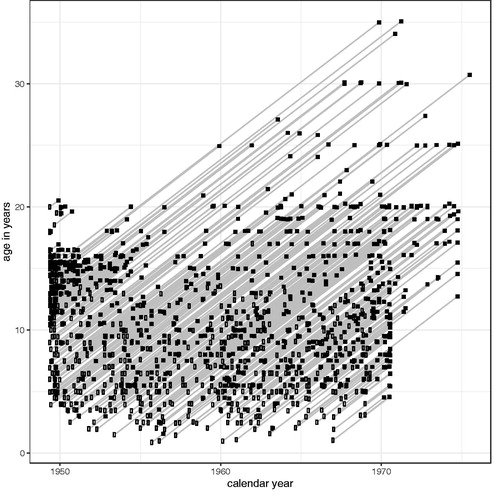
Figure 2. Data for one girl (ID 2113) from the Harpenden Growth Study between 3 and 20 years.
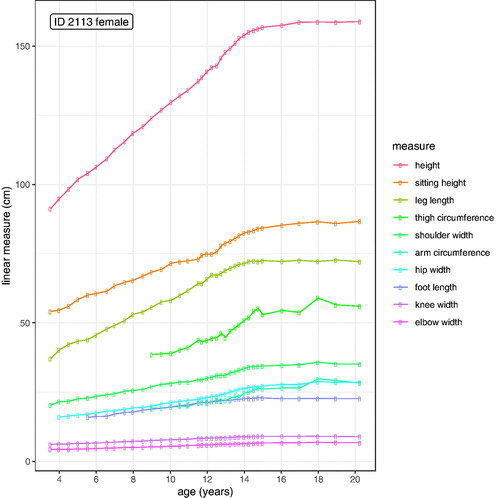
Figure 3. Mean curves for the Harpenden Growth Study SITAR length models by sex.
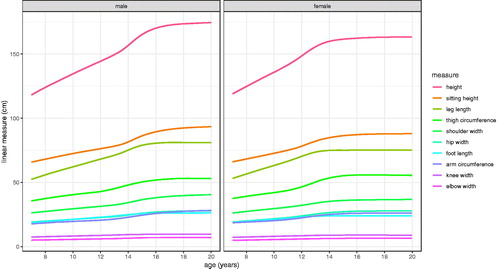
Table 1. Summary of the SITAR models fitted to ten linear measurements in boys and girls of the Harpenden Growth Study.
Table 2. Summary statistics for the SITAR model random effects in .
Figure 4. Mean curves for the Harpenden Growth Study SITAR length models by sex, with length on a log 2 scale to highlight the similarities in curve shape.
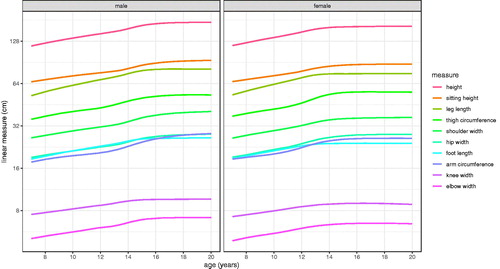
Figure 5. Mean velocity curves (cm/yr) for the Harpenden Growth Study SITAR length models by sex (girls left, boys right), with the ages at peak velocity indicated by vertical lines.
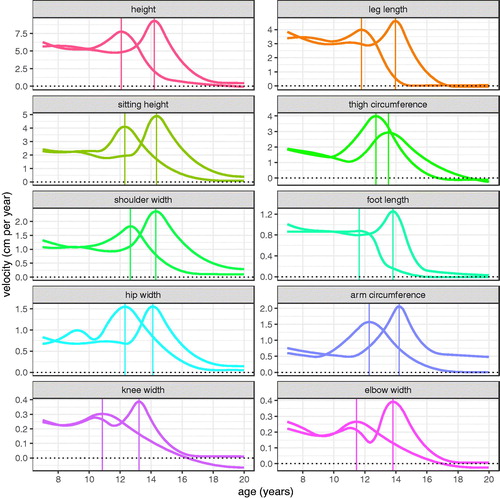
Figure 6. Mean percent velocity curves for the Harpenden Growth Study SITAR length models by sex (girls left, boys right), with the ages at peak velocity indicated by vertical lines.
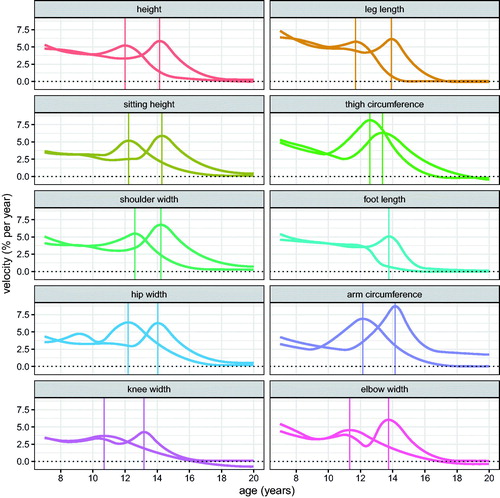
Table 3. Summary statistics for mean linear and percent velocity at takeoff and peak, and their mean ages, in the SITAR models.
Figure 7. Height data for 5227 boys and 5183 girls in ALSPAC, collected over nine data sweeps between 9 and 17 years.
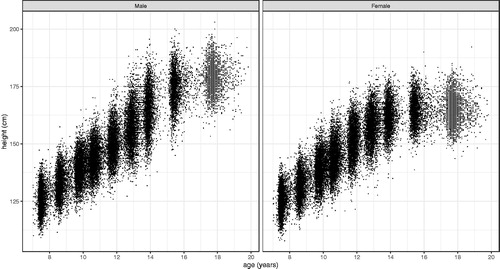
Figure 8. SITAR mean height and height velocity curves for ALSPAC by sex, with the ages at peak velocity indicated by vertical lines (girls left, boys right).
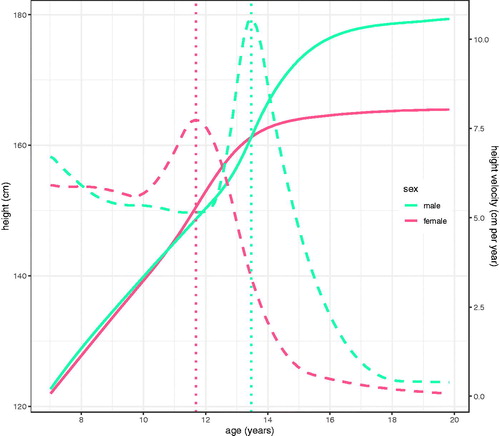
Table 4. Summary of the height SITAR models for boys and girls in ALSPAC.
Table 5. Summary of height SITAR models for boys and girls in ALSPAC split into nine groups by age at peak height velocity.
Table 6. Summary of the height SITAR models for boys and girls in ALSPAC split into nine groups by age at peak height velocity.
Figure 9. SITAR mean height and height velocity curves for ALSPAC girls, split into nine groups by age at peak height velocity. The left panels are predictions from the global model, while on the right are the group-specific mean curves.
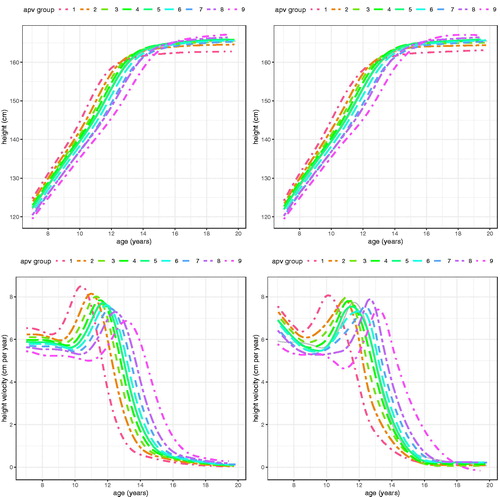
Figure 10. SITAR mean height and height velocity curves for ALSPAC boys, split into nine groups by age at peak height velocity. The left panels are predictions from the global model, while on the right are the group-specific mean curves.
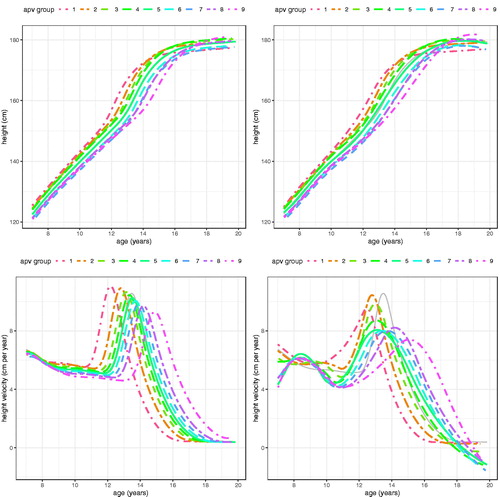
Figure 11. SITAR mean height velocity curves for ALSPAC girls, split into nine groups by age at peak height velocity (APV) and in turn five groups by peak height velocity (PV).
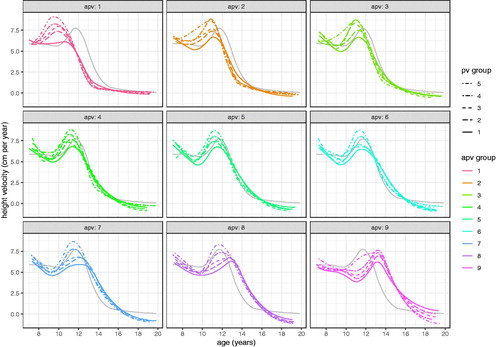
Figure 12. SITAR mean height velocity curves for ALSPAC boys, split into nine groups by age at peak height velocity (APV) and in turn five groups by peak height velocity (PV).
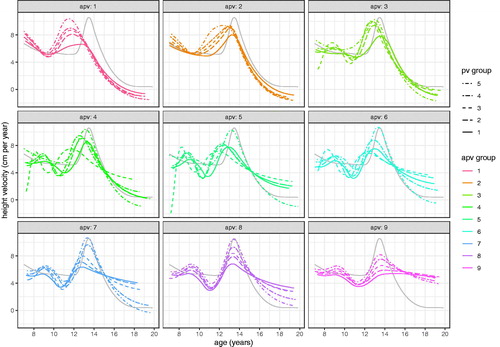
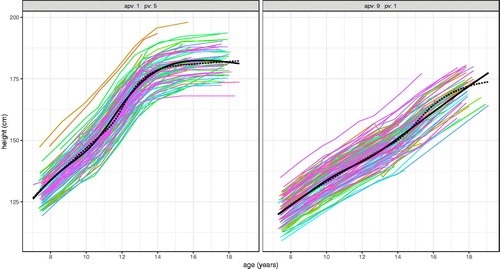
Figure 13. Height growth curves for ALSPAC boys with two contrasting patterns of development; left) early and fast - APV group 1 and PV group 5 (n = 116), and right) late and slow – APV group 9 and PV group 1 (n = 117). The corresponding SITAR mean curves are shown as solid black lines, and the dotted lines are predicted mean curves (based on mean APV and mean PV) from the global SITAR model.
Supplemental Material
Download PDF (148.8 KB)Data availability
The Harpenden Growth Study data were kindly made available by Professor Noël Cameron (Loughborough University). The ALSPAC data were made available courtesy of the ALSPAC Executive Committee (project proposal B1036).