
Figures & data
Figure 1. Flowchart of the subject selection. BMD: bone mineral density; BTMs: bone turnover markers; BMI: body mass index; T2DM: type 2 diabetes.
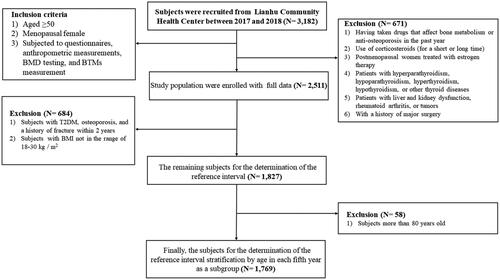
Table 1. Reference intervals of P1NP, β-CTX and P1NP/β-CTX for the older adults.
Figure 2. Reference intervals of P1NP, β-CTX and P1NP/β-CTX in different age groups of the older adults. (a) Male P1NP; (b) Female P1NP; (c) Male β-CTX; (d) Female β-CTX; (e) Male P1NP/β-CTX; (f) Female P1NP/β-CTX.
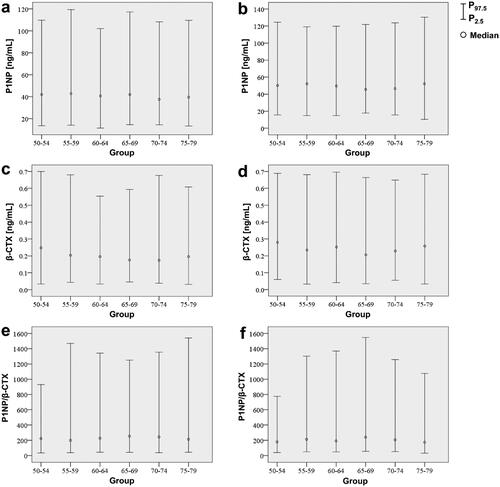
Table 2. Establishment and comparison of reference values for BTMs between older men and postmenopausal women after stratification by 5 yr increments in the older adults.
Figure 3. Scatter plots and LOWESS curves of age-dependent BTM levels in older men and postmenopausal women. (a) Male P1NP; (b) Female P1NP; (c) Male β-CTX; d) Female β-CTX; (e) Male P1NP/β-CTX; (f) Female P1NP/β-CTX. The single values (black dots) and the trend lines (blue lines) with 95% confidence intervals (shaded in light blue) shown in the figure were obtained by the LOWESS regression model. BTM-bone turnover markers; LOWESS curve-local weighted regression curves.
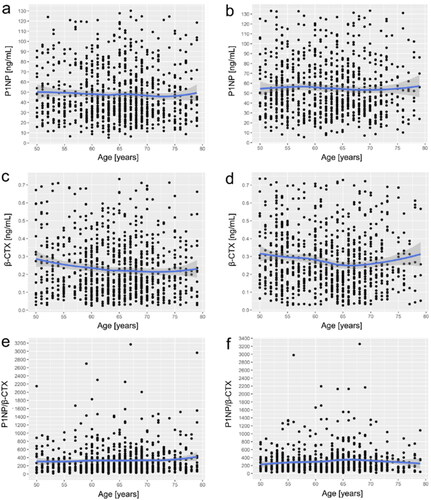
Figure 4. Scattered diagram and centile curves of BTM levels against age in older men and postmenopausal women. (a) Female P1NP; (b) Male P1NP; (c) Female β-CTX; (d) Male β-CTX. The 1rd, 5th, 25th, 50th, 75th, 95th and 99th centile curves are shown respectively. BTM-bone turnover markers.
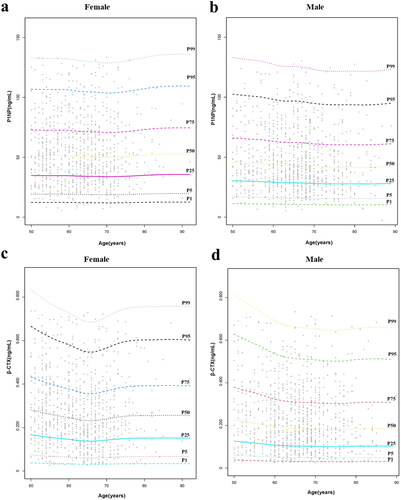
Table 3. Correlations between BTMs and BMD at different skeletal sites.
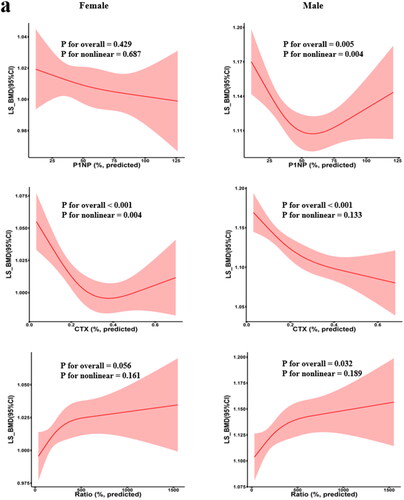
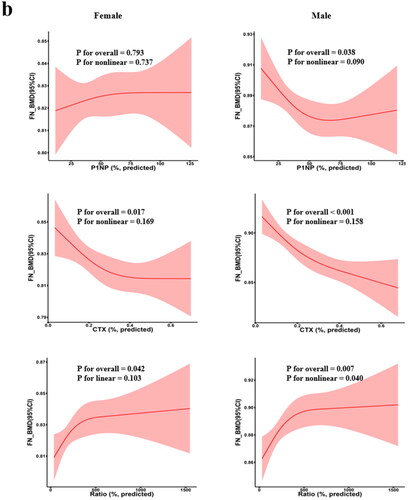
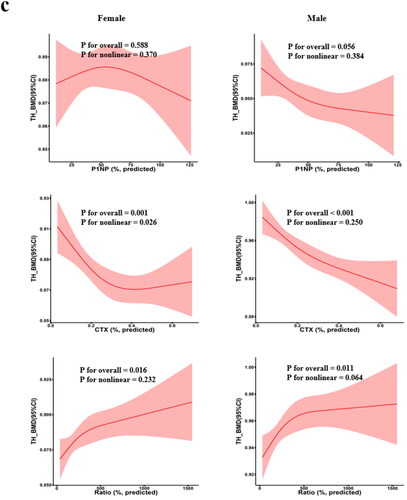
Table 4. Multiple linear regression analyses between BMD and other covariates.