Figures & data
Figure 1. Comparison of growth charts for infants and children with Down syndrome, 0–36 months of age. The UK 2002 charts (Styles et al. Citation2002) were compared to charts from the US 1988 (Cronk et al. Citation1988) and the Down Syndrome Growing Up Study (DSGS) (Zemel et al. Citation2015). Shown are the 5th, 50th, and 95th percentiles for weight (A) and length/height (B) for males and females.
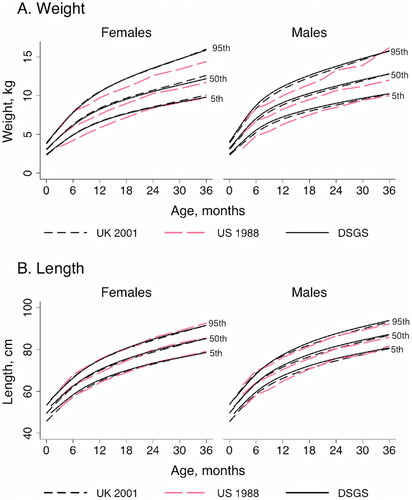
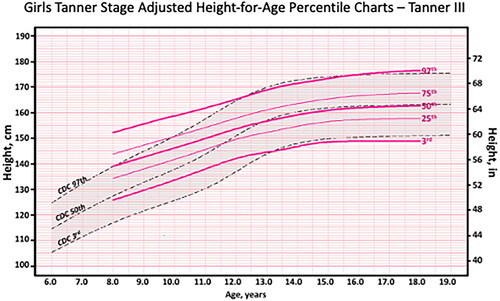
Figure 2. Comparison of growth charts for children and adolescents with Down syndrome, 2–20 years of age. The UK 2002 charts (Styles et al. Citation2002) were compared to charts from the US 1988 (Cronk et al. Citation1988) and the Down Syndrome Growing Up Study (DSGS) (Zemel et al. Citation2015). Shown are the 5th, 50th, and 95th percentiles for weight (A) height (B) for males and females.
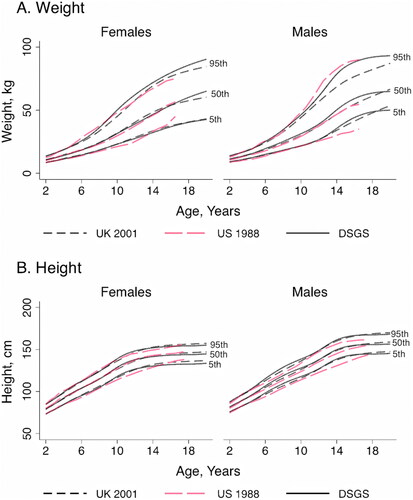
Figure 3. Example of SITAR modelling applied to height growth of African American (AA) versus non-African American (non-AA) male and female participants from the Bone Mineral Density in Childhood Study (from McCormack et al. Citation2017). Height velocity curves illustrate the difference in timing of peak height velocity (tempo) between AA and non-AA girls, and between males and females.
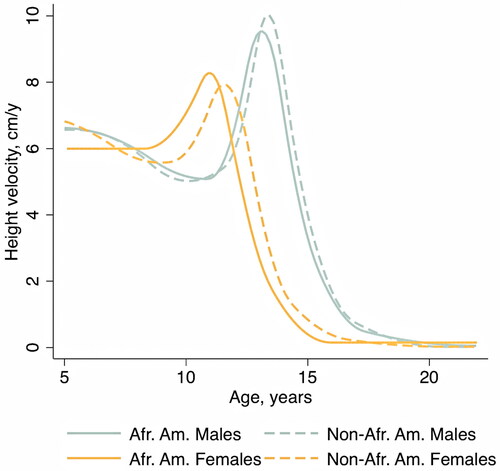
Figure 4. Example of Tanner stage adjusted height-for-age percentile chart for girls in Tanner stage III. From Miller et al. (Citation2020, appendix Figure 10).