
Figures & data
Table 3. Selected studies examining the relationship between Cd and CKD ≥ stage 3/ESKD (exposure based on blood or urine [Cd] [A] and dietary surveys or proximity to battery plants (ie ecological fallacy) [B]).
Table 1. Baseline characteristics for total sample and subgroups.
Table 2. Binary logistic regression of CKD Stage≥ 3 and covariates on Cd.
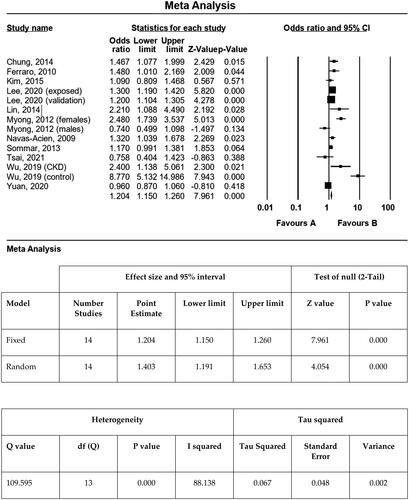
Figure 1. Meta-analysis of cadmium and chronic kidney disease (CKD).
Data availability statement
Data sharing is not available as this is protected by stipulations in the IRB.