Figures & data
Table 1. Students enrolled in the final years of elementary school in the state and municipal networks, urban and rural part-time in the city of Santa Cruz do Sul/RS.
Table 2. Family Income by Social Class.
Table 3. Sociodemographic characteristics of the schoolchildren participating in the study.
Table 4. Hematological characteristics of the schoolchildren.
Figure 1. Association between social class and haemoglobin (A), ferritin (B), Corpuscular Volume Mean (C), and eosinophil (D) levels. p = significance level according to Kruskal-Wallis test. Mean plus or minus standard error of the mean.
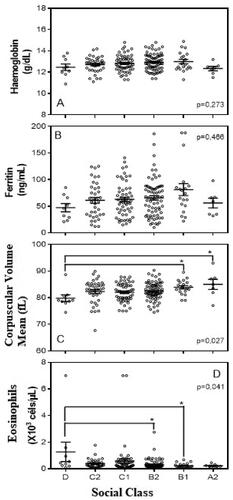
Figure 2. Association between haemoglobin levels according to ferritin levels P = significance level according to Kruskal-Wallis test.
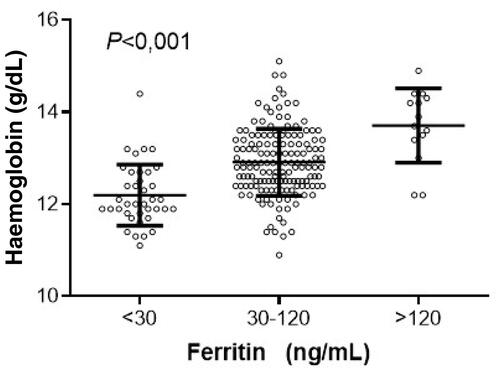
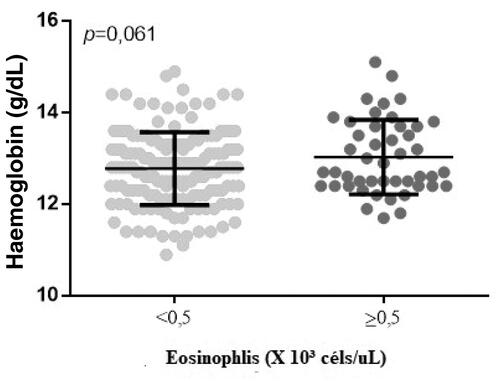
Figure 3. Association between haemoglobin levels and eosinophil levels. p = level of significance according to Mann-Whitney U test.