
Figures & data
Figure 1. Participant flow chart.
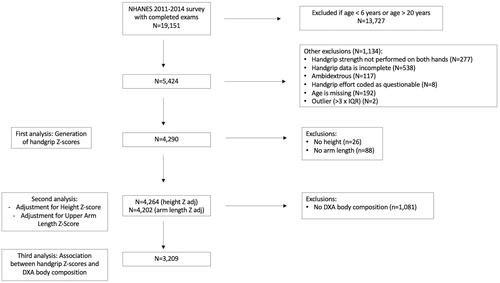
Table 1. Descriptive characteristics of the NHANES sample population used to create handgrip reference curves.
Figure 2. Reference curves for dominant and non-dominant handgrip by gender (A) and difference between dominant and non-dominant handgrip with age (B).
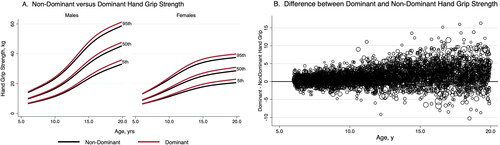
Table 2. Reference tables for dominant hand grip (A), non-dominant handgrip (B), and upper arm length (C) in male participants ages 6–19.9 years.
(B) Non-dominant handgrip, kg
(C) Upper arm length, cm
Table 3. Reference tables for dominant hand grip (A), non-dominant handgrip (B), and upper arm length (C) in female participants ages 6-19.9 years.
(A) Dominant handgrip, kg
(B) Non-dominant handgrip, kg
(C) Upper arm length, cm
Table 4. Correlations between unadjusted and adjusted handgrip Z-scores, anthropometric, and body composition measures using data from 3209 NHANES participants with complete DXA data.
Table 5. Equations to predict D-HGZ and ND-HGZ based on body size as described in Equation 3 in text.
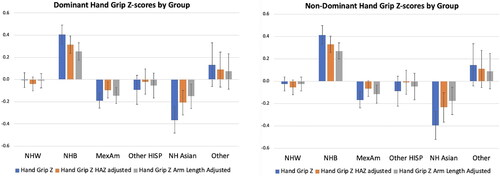
Figure 3. Dominant and non-dominant handgrip Z-scores by race/ethnicity group.
Supplemental Material
Download Zip (802.2 KB)Data availability statement
The data that support the findings of this study are openly available from the Centres for Disease Control and Prevention (CDC), National Centre for Health Statistics (NCHS). National Health and Nutrition Examination Survey Data. Hyattsville, MD: U.S. Department of Health and Human Services, Centres for Disease Control and Prevention, 2011–2014, https://wwwn.cdc.gov/nchs/nhanes/continuousnhanes/overview.aspx?BeginYear=2011 and https://wwwn.cdc.gov/nchs/nhanes/continuousnhanes/overview.aspx?BeginYear=2013.