
Figures & data
Figure 1. (A) Identification of DEGs. (B) Identification of DEMFRGs. (C) GO enrichment analysis of DEMFRGs. (D) KEGG pathway enrichment analysis of DEMFRGs.
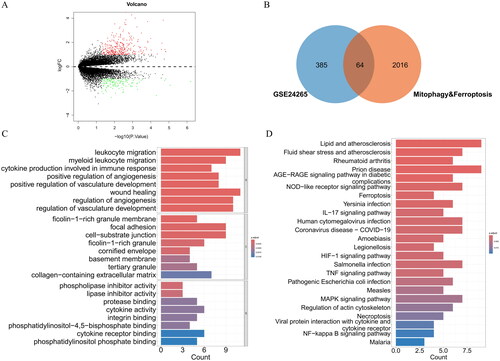
Figure 2. (A) PPI network of DEMFRGs. (B) PPI network of the 10 hub genes identified by the MCODE algorithm. (C) PPI network of the 10 hub genes identified by the MCC algorithm. (D) Heatmap of gene expression for the 10 hub genes in the Healthy group and ICH group. (E) Boxplot of gene expression for the 10 hub genes in the Healthy group and ICH group. *p < .05; **p < .01; ***p < .001. (F) Correlation heatmap of the 10 hub genes.
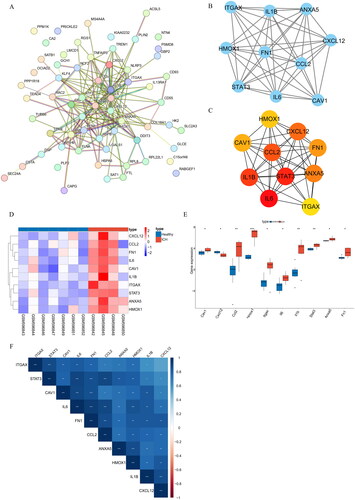
Figure 3. (A) ROC curves of the 10 hub genes in the GSE24265 dataset. (B) ROC curves of the 10 hub genes in the GSE149317 dataset.
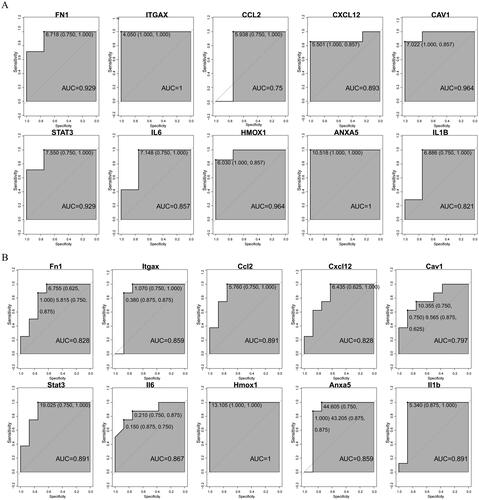
Figure 4. miRNA-hub gene interaction network. Green triangles represent hub genes; orange dots represent miRNAs.
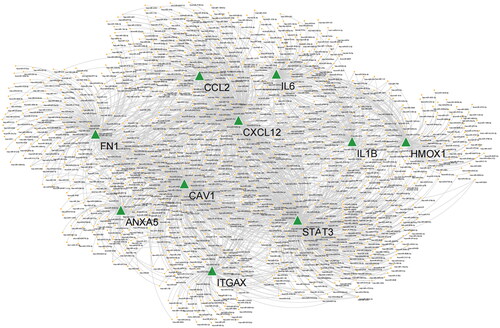
Figure 5. (A–B): Differential analysis of immune microenvironment based on ssGSEA algorithm. (C): Differential analysis of immune microenvironment based on CIBERSORT algorithm. (D): Differential analysis of immune microenvironment based on MCP algorithm. (E): Differential analysis of immune microenvironment based on xCell algorithm. *p < .05; **p < .01; ns: p > .05.
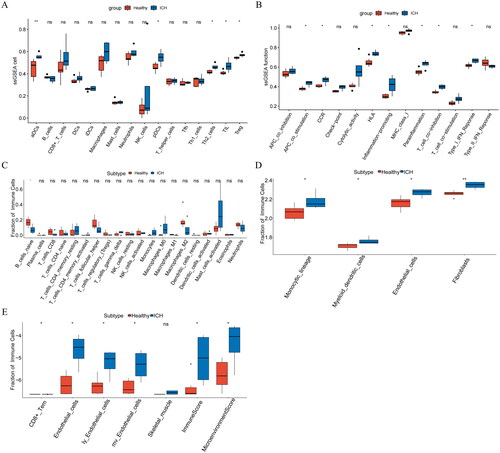
Table 1. ICH-targeted small molecule drugs predicted through cMAP database.
Supplemental Material
Download MS Excel (100.5 KB)Data availability statement
The data and materials in the current study are available from the corresponding author on reasonable request.