
Figures & data
Figure 1. (A) The expression of CRGs between the AD and control groups with Wilcoxon rank-sum test.(*indicates p < 0.05, **indicates p < 0.01, ***indicates p < 0.001, and NS indicates no statistical significance) (B) The dot plot visualised the main pathways obtained by KEGG pathway enrichment analysis (P.adj < 0.05). (C) Molecular correlation among the 12 DECRGs. (D) The dot plot visualised the main results (Top 3 categories for that ontology) obtained by Gene Ontology Term Enrichment analysis.
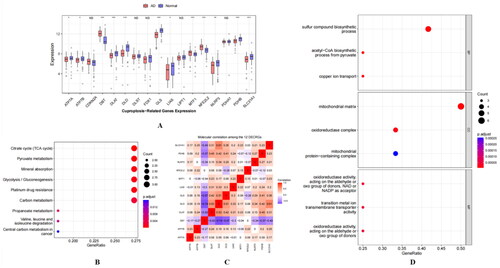
Figure 2. (A) Construction of Random forest (RF) model. (B) Ranking of the 12 DECRGs based on Mean Decrease Accuracy. (C) The ROC curve of training set. (D) The ROC curve of test set. (E) ROC curves of external validation set.
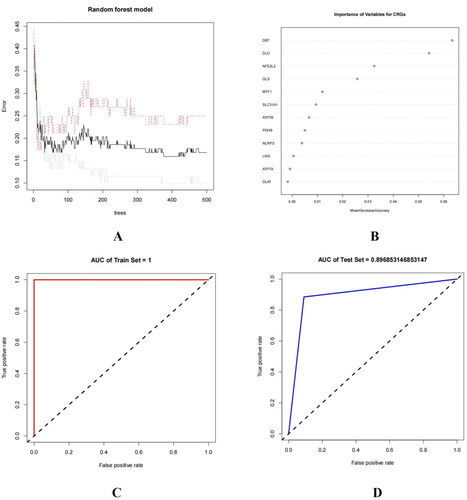
Figure 3. Validation of most important 5 CRGs and molecular typing. (A) ROC curve of most important 5 CRGs in the external validation set (B) Consensus clustering of 87 AD samples.(C) consensus CDF of each K (D)relative change in the area under the CDF curve (E) Heatmap of the expression of each gene in the four subtypes. (F) Boxplot of the expression of each gene in the four subtypes.
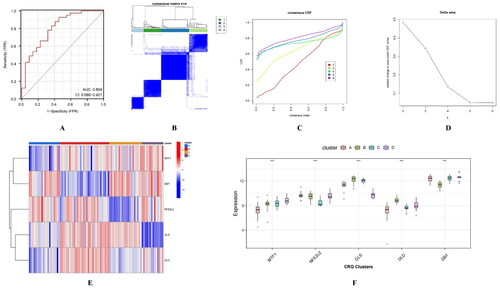
Figure 4. Construction of a nomogram model. (A) Nomogram model. (B) Calibration curve of the model. (C) DCA curve of the model. (D) Clinical impact curve of the model.
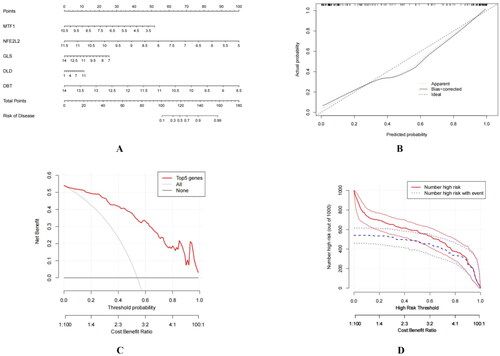
Figure 5. Identification of CRGs associated with DELncRNAs. (A) 1,043 lncRNA probes in GSE5281. (B) DELncRNAs in GSE5281. (C) Co-expression network of DELncRNAs and five CRGs (The blue lines indicate negative correlation (R< −0.3), while the red lines represent positive correlation (R > 0.3)).
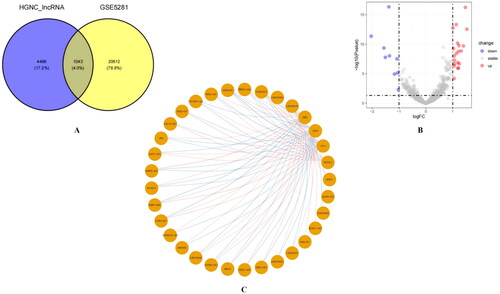
Figure 6. The ceRNA network of 11 lncRNAs,11 miRNAs, and five cuproptosis-related mRNAs.
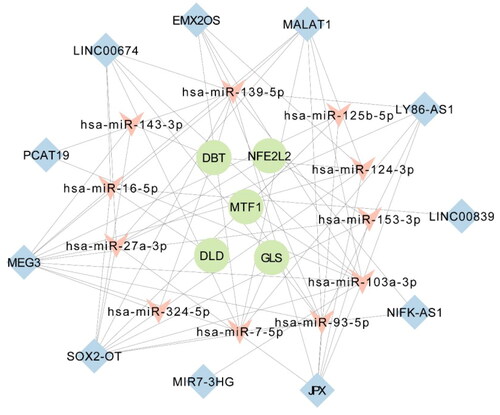
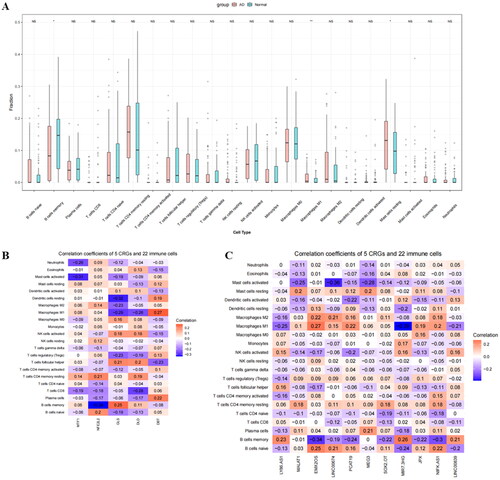
Figure 7. Evaluation and visualisation of immune cell infiltration and the correlation between cuproptosis-related markers and infiltrating immune cells. (A) Box plot of immune cell infiltration differences among the 22 types of immune cells between AD and normal samples (*indicates p < 0.05, **indicates p < 0.01, ***indicates p < 0.001, and NS indicates no statistical significance). (B) The correlation between CRGs and 22 types of immune cells. (C) The correlation between cuproptosis-related lncRNAs and 22 types of immune cells.
Supplemental Material
Download Zip (502.7 KB)Data availability statement
All data are available in Supplemental Tables of this manuscript.