
Figures & data
Figure 1. Schematic outline of the process followed to create and test the two scenarios to achieve a healthy diet.
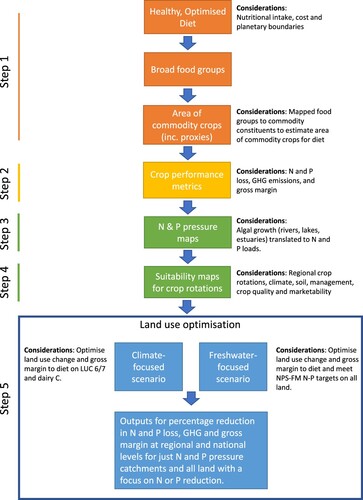
Table 1. Annual production, per hectare production required, and the crop areas required (and in addition to areas above current production) to grow the optimised healthy diet. Information is also given about the areas available for crop rotations, on average, within N and P pressure catchments. Refer to Table S3 for information on the crop rotations in major crop growing regions.
Table 2. Current area and the environment, production, and economic performance of agricultural product classes for a low GHG diet for New Zealand.
Figure 2. Areas (ha) of different crops grown for both scenarios in catchments under pressure for nitrogen (top) and phosphorus (bottom). Note that these data are not adjusted for rotations. For example, a crop may only be grown in one out of four years and require times the area to meet targeted yield. Total cropland in catchments under N pressure for the climate and freshwater-focused scenarios were 37,693 and 46,862 ha, respectively, while areas under P pressure were 34,671 and 45,763 ha, respectively. To adjust individual crop areas to account for their production within a rotation across New Zealand, areas outside of pressure catchments can be adjusted for wheat and barley, oats, potatoes, onions, peas and beans by dividing by 0.355, 0.37, 0.30, 0.43, 0.43 and 0.33, respectively.
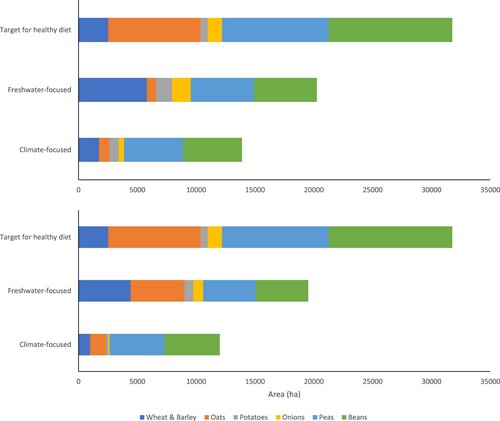
Figure 3. Percentage change across New Zealand in sheep and beef, dairy, forestry, and crops (adjusted for non-target crops in region-specific rotations) from current areas under both scenarios when focused on reducing nitrogen (top) or phosphorus (bottom). Current areas in sheep and beef, dairy, forestry, and cropland are 11.27, 2.24, 1.61, and 0.33 M ha, respectively.
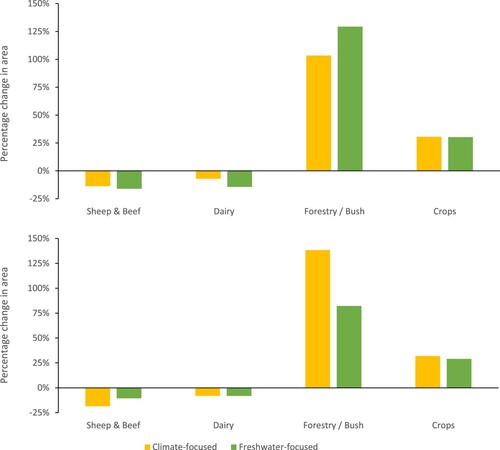
Table 3. Effect of each scenario on the non-optimised percentage change in nitrogen and phosphorus load, greenhouse gas emissions and gross margin, in catchments under pressure from nitrogen and phosphorus and when these data are scaled up (along with land use changes outside pressure catchments) to the national level focusing on N or P. Values in parentheses are the standard error calculated from regional values.
Table 4. Effect of land use change on absolute ($M) gross margin in pressure catchments focusing on N or P.
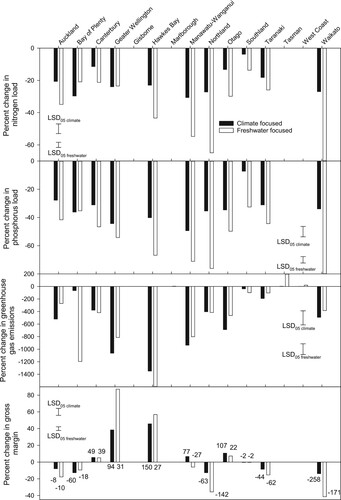
Figure 4. Effect of each scenario on the percentage change in nitrogen and phosphorus load, greenhouse gas emissions and gross margin in catchments under pressure from nitrogen in each region. The least significant difference at the P < 0.05 level is given for the contrast of regional means for both scenarios. Values refer to absolute estimated change in gross margin (millions NZD). Note that some decreases in greenhouse gas emissions exceed the y-axis scale.
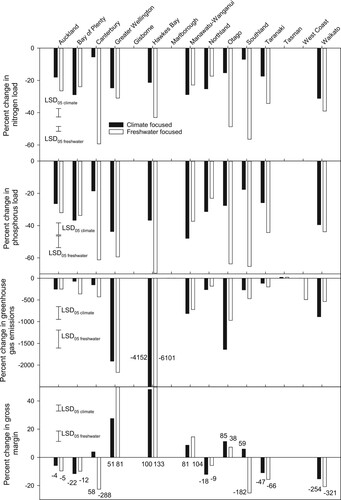
Figure 5. Effect of each scenario on the percentage change in nitrogen and phosphorus load, greenhouse gas emissions and gross margin in catchments under pressure from phosphorus in each region. The least significant difference at the P < 0.05 level is given for the contrast of regional means for both scenarios. Values refer to absolute estimated change in gross margin (millions NZD).
Supplemental material
Download MS Word (8.9 MB)Data availability statement
The supplementary data that support the findings of this study are openly available in figshare at https://doi.org/10.6084/m9.figshare.16614124.