
Figures & data
Figure 1. Schematic overview of the study describing data sources, dependent (red) and independent (green) information generating events (chronologically from left to right), and tools used for data processing and analysis.
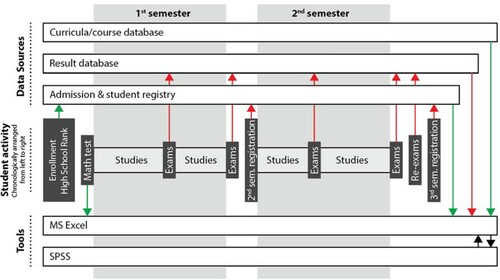
Table 1. Composition of studied programs during the first two semesters based on main subject occurrences for courses in the program. For each main subject, the number of occurrences of each program is specified. Grey cells indicate subjects that were judged to be native for the program, given its degree title. The total number of courses differ from the sum of all main subjects because a course might be classified with up to three main subjects. Rightmost column provides program reference numbers to be used throughout the paper.
Table 2. The types of assessment methods for each program, the distribution between the different methods, and the resulting Active Learning Credit ratio (ALC).
Table 3. Studied population descriptives.
Table 4. Student performance.
Table 5. Resulting model for predicting GP after stepwise multiple linear regression analysis.
Table 6. Alternative model for predicting GP including both NC and ALC.
Table 7. Alternative model for predicting GP including NC instead of ALC.
Figure 2. Summary point plot of means of NCA/non-NCA ratios by math test results. Possible results on the math test are discrete values between 0 and 26.
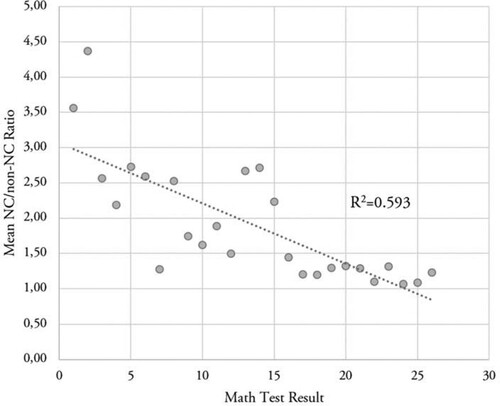
Table 8. Grey-scaled comparison matrices sorted by descending GP (left) and descending NC (right), including group level means of studied variables.