Figures & data
Table 1. Focus group participant demographic.
Figure 1. Example of journey map from Dagg et al. (Citation2019).
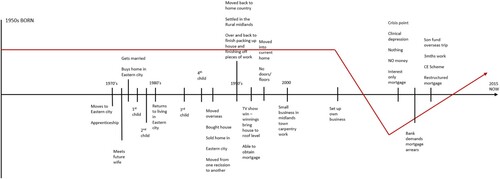
Figure 2. Example of journey map from Dagg et al. (Citation2019).
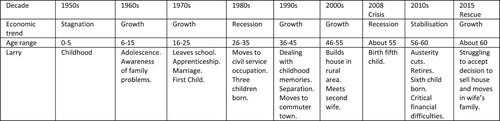
Figure 3. Example of student journey map (excerpt provided for anonymity).
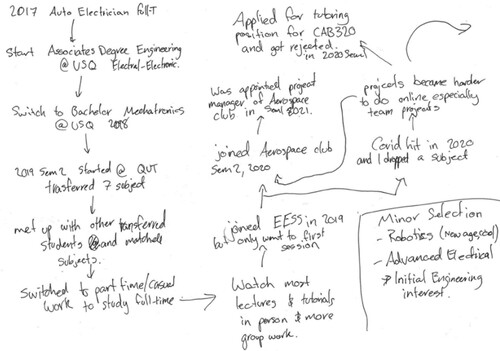
Figure 4. Example of student journey map (excerpt provided for anonymity).
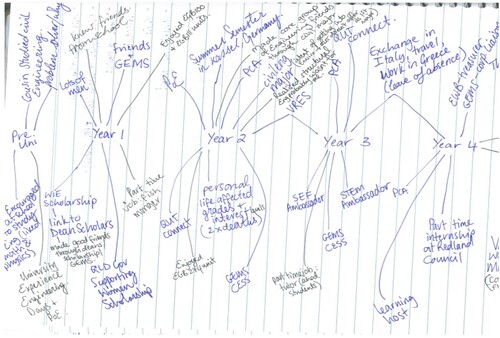
Figure 5. Example of translated and annotated student journey map.
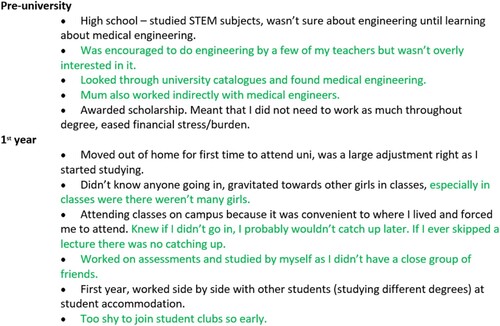
Figure 6. Framework for students’ identification with engineering adapted by Godwin (Citation2016).
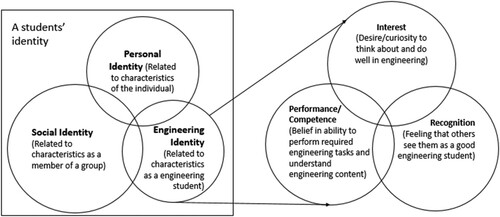
Figure 7. Framework for students’ identification with engineering adapted to include person and social identity within engineering identity.
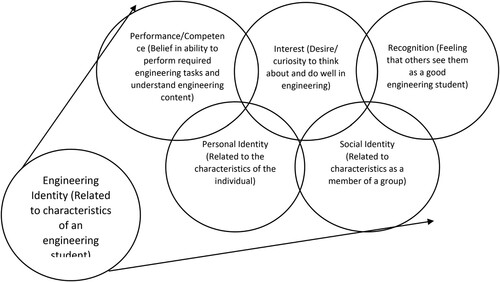
Figure 8. Framework for students’ identification with engineering and ten key themes previously identified by the research team used for coding the data.
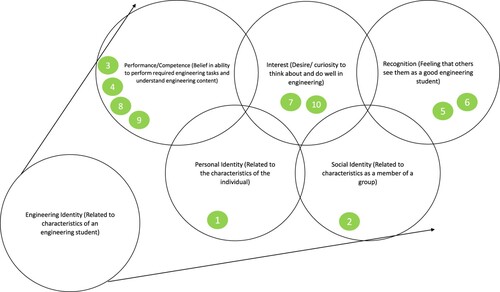
Table 2. Participants who identified as an engineer by demographic.
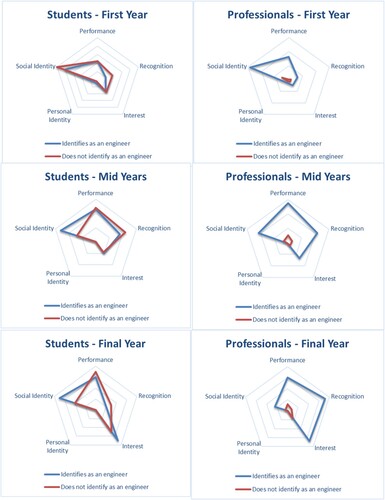
Figure 9. Findings from journey maps coded against the adapted model of engineering identity across first year, mid-years and final year for student and professionals.