
Figures & data
Figure 1. Changes in school belonging 2003–2015 across EU and OECD countries. Data from PISA (waves 2000, 2003, 2012, 2015, 2018). Only countries with complete data on school belonging from all survey waves (2000–2018) included.
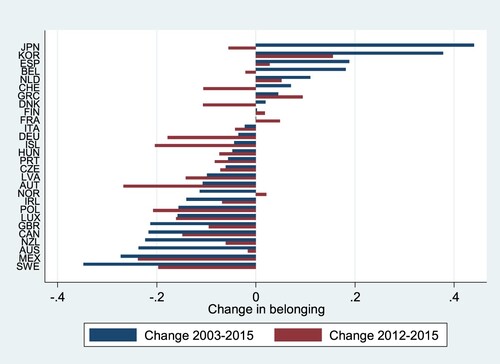
Figure 2. Trends in school belonging 2000–2018. Data from PISA (waves 2000, 2003, 2012, 2015, 2018). Only countries with complete data on school belonging from all survey waves (2000–2018) included.
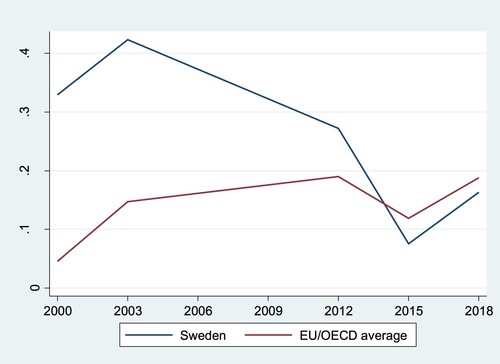
Figure 3. School belonging in Sweden compared to synthetic Sweden. Data from PISA (waves 2000, 2003, 2012, 2015, 2018). Only countries with complete data on school belonging from all survey waves (2000–2018) included.
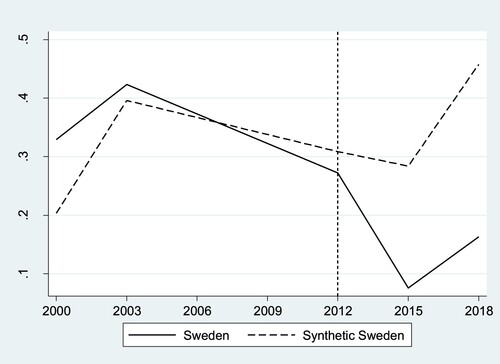
Figure 4. Gap in school belonging between each country and its synthetic counterpart. Data from PISA (waves 2000, 2003, 2012, 2015, 2018). Only countries with complete data on school belonging from all survey waves (2000–2018) included.
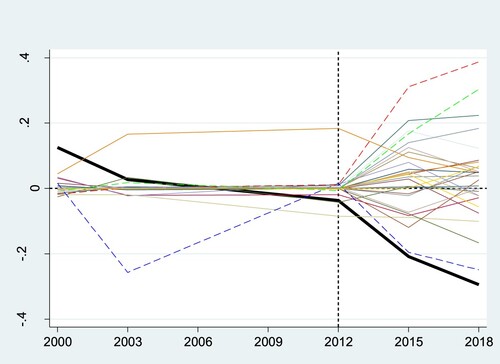
Table 1. Two-way fixed effects regression models with school belonging as the outcome.