
Figures & data
Figure 1. Percentage of municipality area under collective titling.
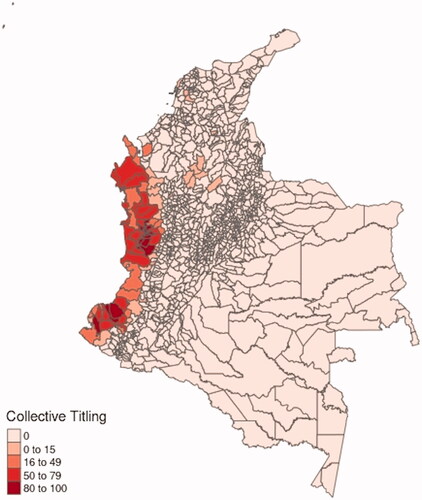
Figure 2. Game tree.
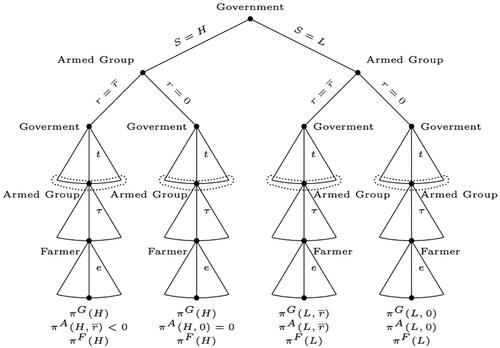
Figure 3. Model thresholds. Panel (a): armed group's threshold. Panel (b): government's threshold.
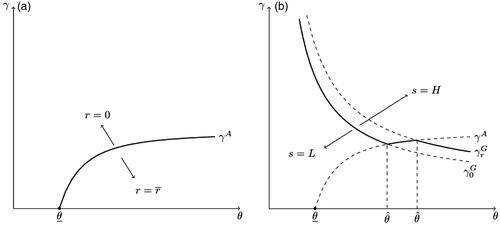
Figure 4. Equilibria. Panel (a): equilibria. Panel (b): correlation between productivity and modern agriculture. Note. Area I: low security and no displacement. Area II: low security and displacement. Area III: high security and no displacement.
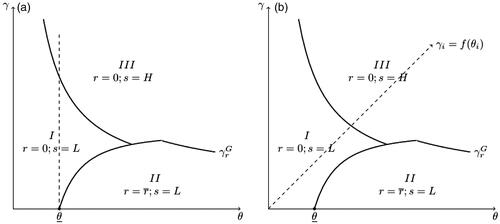
Table 1. Description of variables.
Table 2. Dependent and control variables descriptive statistics.
Table 3. Fixed-effects estimations.
Table 4. Robustness check.
Table 5. Cross-section estimations.