Figures & data
Table A1. Descriptives of variables in graduate survey datasets 1996–2017
Figure 1. Adult literacy skill levels in the Netherlands in 1994 and 2012, by age group and highest attained education.
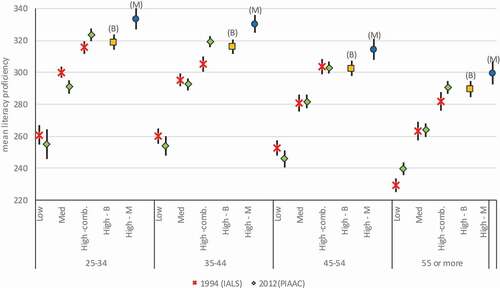
Figure 2. Unemployment risk of HBO bachelors and university masters 1–2 years after graduation relative to BOL-4, 1998–2017.
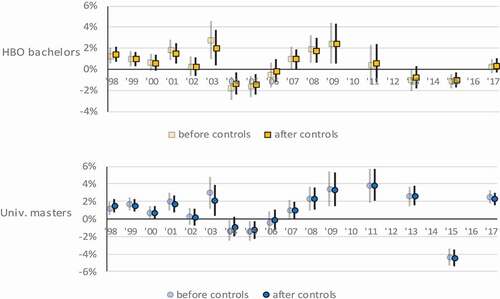
Figure 3. Hourly earnings (2017 euros) of HBO bachelors and university masters 1–2 years after graduation relative to BOL-4, 1998–2017.
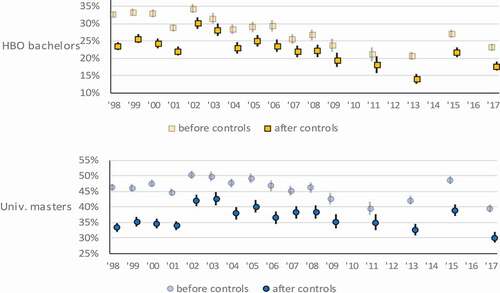
Figure 4. Education-occupation match, by broad level of education, 1996–2017.
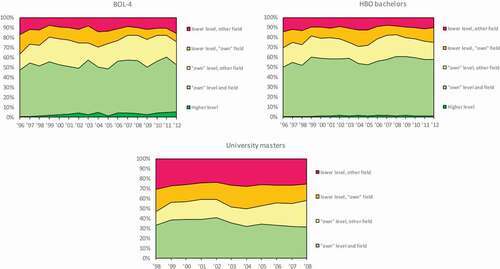
Figure 5. Effects of average final grades on labour market outcomes 1–2 years after graduation, HBO bachelors and university masters, 2003–2017.
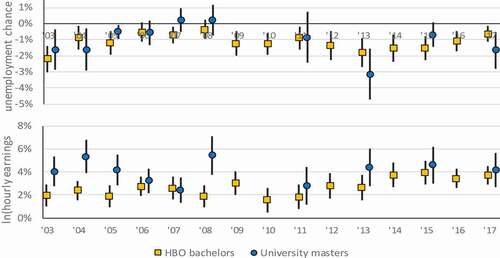
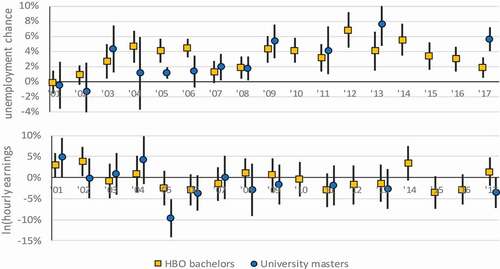
Figure 6. Effects of gender (females versus males) on chance of being unemployed and earnings 1–2 years after graduation, 1998–2017.
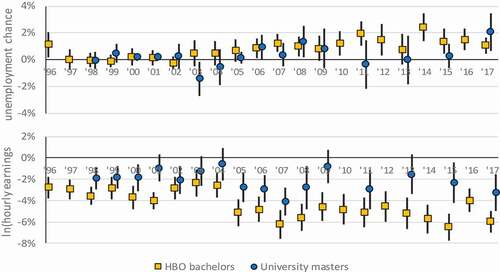
Figure 7. Effects of a first-generation non-western migration background (versus native Dutch) on labour market outcomes 1–2 years after graduation, HBO bachelors and university masters, 2001–2017.