
Figures & data
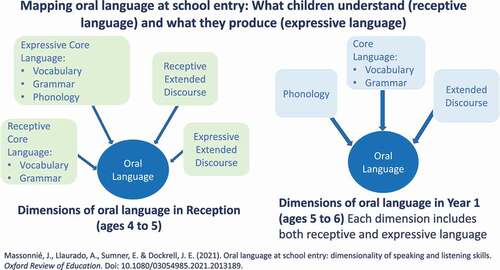
Table 1. Descriptive statistics for all measures (raw scores).
Table 2. Correlations between all the variables.
Figure 1. Alternative CFA models representing the dimensionality of oral language based on language components and/or modalities. (R): Receptive; (E): Expressive.
Figure 1. Continued.
Figure 1. Continued.
Table 3. Model fit statistics for the six alternative CFA models in Reception and Year 1.
Table 4. Model comparisons (Satorra-Bentler Chi-Square Difference Test).
Figure 2. Best fitting model in Reception: all paths significant at the <.001 level.
Figure 3. Best fitting model in Year 1: all paths significant at the <.001 level.
Socio-demographic characteristics of the schools in the sample.