
Figures & data
Table 1. Funded early years enrolments 2018/2019. Source: DENI (Citation2019b).
Figure 1. Segregation scores for pre-school settings (2018–19).
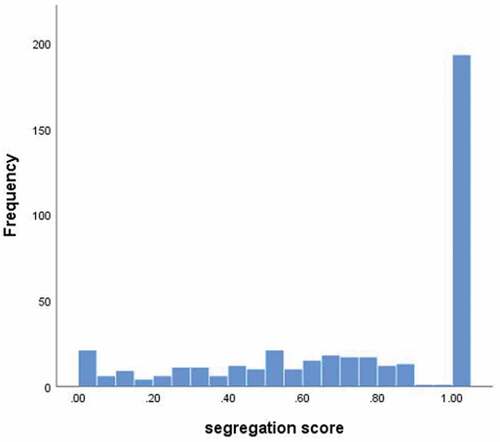
Figure 2. Segregation scores for primary schools in Northern Ireland (2018–19).
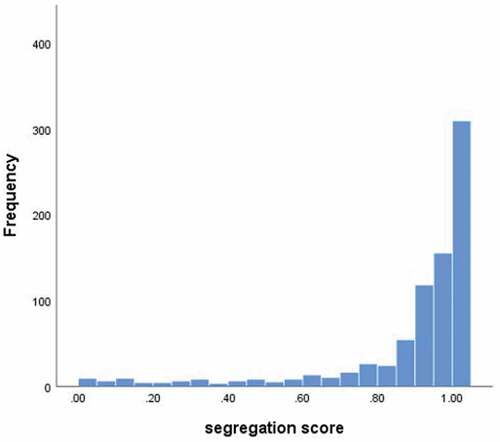
Table 2. Average segregation scores for pre-schools (and sub-sets), primary schools and census small areas.
Figure 3. Segregation in Census Small Areas and pre-schools (all maps to same scale).
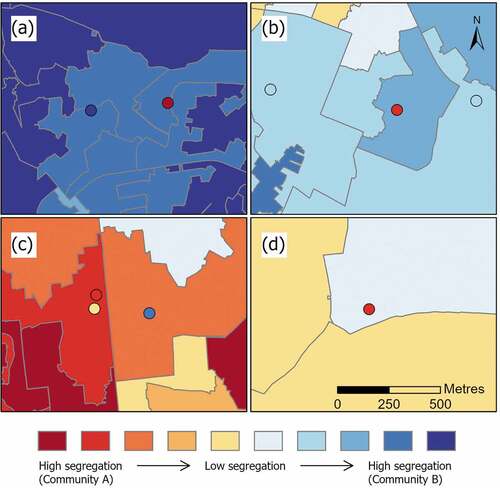
Table 3. Segregation by settlement category: average scores and percentage of pre-schools with higher or unrepresentative segregation (more segregated than the Small Area population, or majority of pupils from the ‘minority’ community for that location).