Figures & data
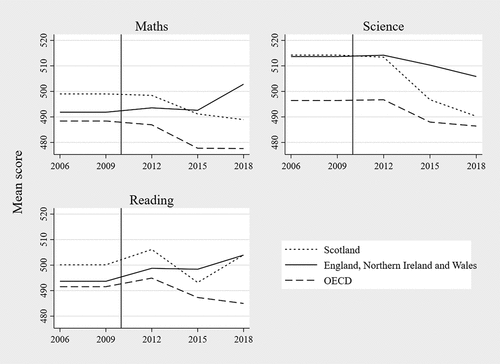
Figure 1. Mean scores of Scotland and other parts of the UK in mathematics, reading and science in selected PISA waves.
Notes. (a) The vertical straight line indicates the implementation of CfE in 2010. (b) The five plausible achievement scores (10 for PISA 2015 and 2018) along with student and school survey weights have been considered in calculating the mean scores in three skill areas in the selected waves. (c) OECD’s average scores also include the UK.
Source. Own calculations based on PISA data (OECD, Citationn.d.).

Table 1. Description of interview participants.
