
Figures & data
Figure 1. NTA of OECD global competence reports.
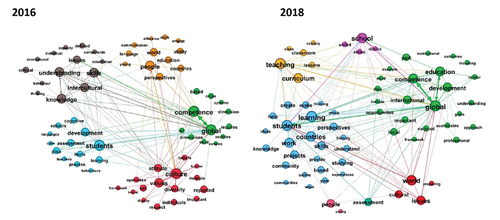
Table 1. Comparison of semantic difference and overlap between OECD’s 2016 and 2018 global competence reports. The table includes only terms with a minimum in-degree of 5.
Table 2. Comparison of betweenness-centrality.
Table 3. Comparing the global semantic galaxy.