Figures & data
Table 1. Agrarian structure: estimated landholdings from 1980 to 2010.
Table 2. National classification of (A2) farms.
Figure 1. Sub-sectoral maize production trends (1980–2010) in Zimbabwe. Source: MAMID (2010a, 2010b).
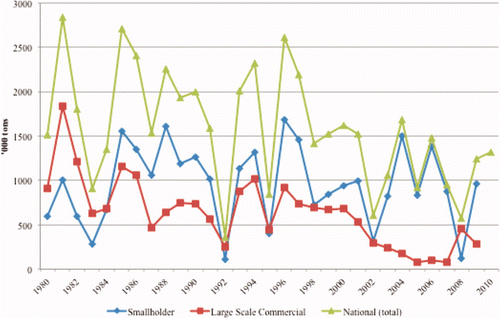
Figure 2. Cereal crops output: 1990s vs. 2000s average. Source: FAO (2009), MIMAD (2010a, 2010b, 2011).
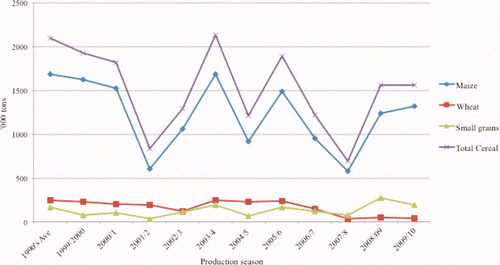
Figure 3. Oilseed output: 1990s vs. 2000s average. Source: TIMB Statistical data, Cotton Ginners Association (2010), MAMID (2011).
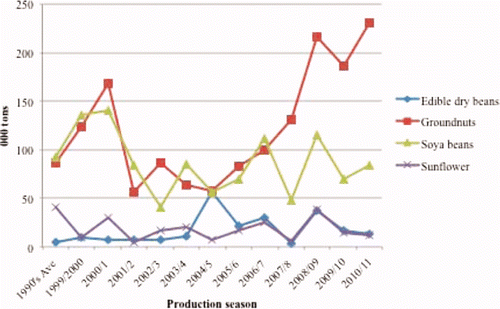
Figure 4. Key exports' output trends: 1990s average vs. 2000s.Source: TIMB Statistical data, Cotton Ginners Association (2010), MAMID (2011).
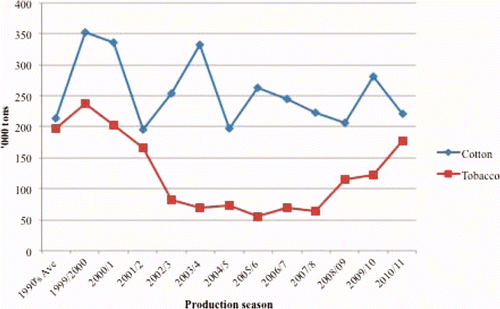
Figure 5. Tea and coffee output trends in Zimbabwe. Source: IMF (2005), Zimbabwe Tea Growers Association data, Zimbabwe Coffee Mills data.
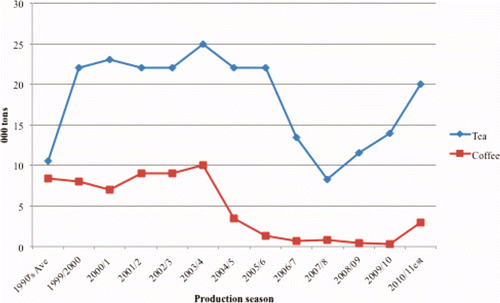
Table 3. Cattle numbers by farming sector: 2001 – 2011.
Figure 6. Small stock production. Source: MIMAD (2010b).
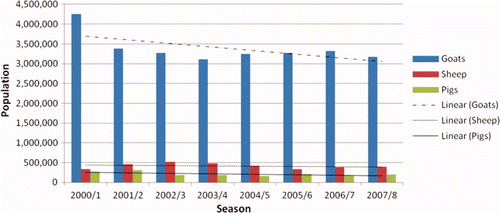
Figure 7. Sub-sectoral utilisation of locally produced fertiliser. Source: Triparthy et al (2007).
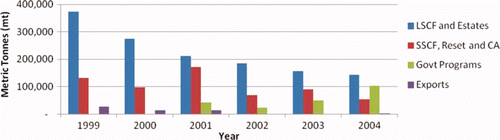
Table 4. Total cropped area by farm size in selected new resettlement areas.
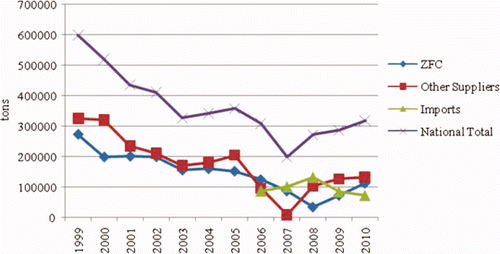
Figure 8. National fertiliser supply (2001 – 2010). Source: Compiled by AIAS from Zimbabwe Fertilizer Company (ZFC) 2010 data.