
Figures & data
Table 1. Countries, regions, villages, sample sizes, 2013/2015.
Table 2. Share of households in the categories ‘wealthy’ and ‘poor’.
Figure 1. Villages showing generalized improvements, by country and region. Villages are denoted by stars. The maps show major road networks and cities. The map is an original map based on data from open sources: Map data from naturalearthdata.com, ESRI World Cities and GRIP; maps drawn by Klara Hällqvist.
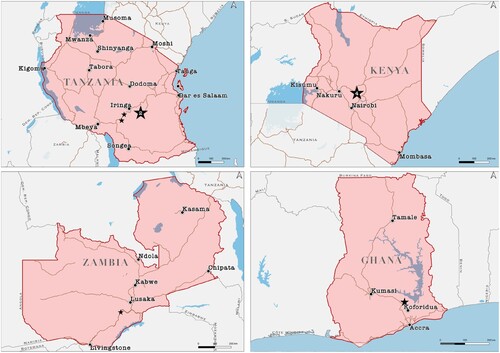
Table 3. Villages showing generalized improvements, by country and region.
Table 4. Share of households who had access to non-farm income, 2002 and 2013/2015, by village. The italicized villages are those that showed generalized improvements over time (see ).
Table 5. Average share of household income generated through non-farm income, 2008 and 2013/2015, by village. The italicized villages are those that showed generalized improvements over time (see ).
Table 6. Gini coefficients for cultivated farm size, 2002 and 2013/2015 by village. The italicized villages are those that showed generalized improvements over time (see ).
Table 7. Changes in Gini coefficients for cultivated farm size by village in the ‘top 10’ villages.