
Figures & data
Figure 1. The structural equation model of the relationships between planning, monitoring, effort, time and critical thinking.
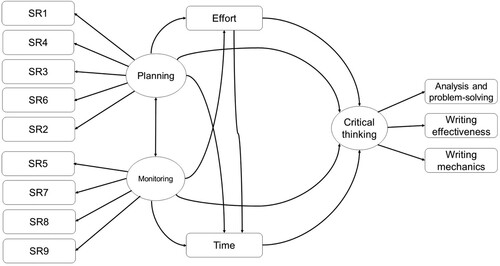
Table 1. Descriptive statistics of items of planning and monitoring in test-taking.
Table 2. Descriptive statistics of test-taking effort, test-taking time, and components of critical thinking.
Figure 2. The structural equation model of the relationships between planning, monitoring, effort, time and critical thinking among initial-stage students.
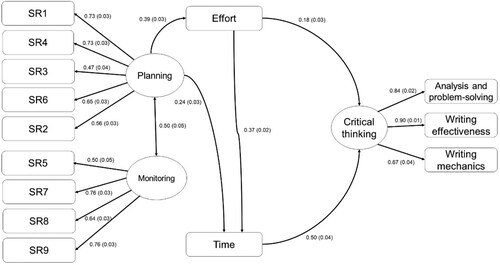
Figure 3. The structural equation model of the relationships between planning, monitoring, effort, time and critical thinking among final-stage students.
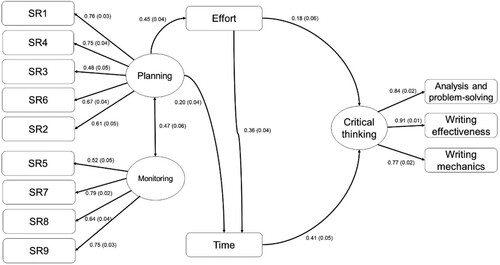
Table 3. Direct, total indirect and total effects in the model for initial-stage students.
Table 4. Direct, total indirect and total effects in the model for final-stage students.